What Does “AARRR” Mean?
Pirate metrics represent a customer-lifecycle framework that focuses growth strategies and performance indicators into major categories. These categories — Acquisition, Activation, Retention, Referral and Revenue, or AARRR for short – are often spoken of as a “pipeline” or visually depicted as an inverted pyramid, with Acquisition at the top, and Referral at the bottom.
The presentation reinforces the philosophy that underpins the framework, which is that customer lifecycle is a pipeline through which customer relationships should be moved to maximize business success.
While many of the measurements on which pirate metrics are built, such as revenue per user, have been popular in business and technology for decades, the terms pirate metrics, AARRR and pirate funnel are relatively new. These terms are most utilized in startup businesses and cutting-edge technology businesses. With that in mind, entrepreneurs, marketing professionals, business and technology employees and Software as a Service companies would be most likely to speak in the language of pirate metrics.
AARRR: что это
Каждая буква обозначает свой шаг воронки. Всего их 5:
Давайте пройдемся по каждому шагу.
Чтобы что-то получить, нужно что-то вложить на входе. Привлечение пользователей, это первый этап нашей воронки. Чтобы нашим продуктом начали пользоваться, о нем как минимум нужно рассказать. Да не просто всем подряд, а целевой аудитории, тем, кому он правда может быть интересен.
На данном этапе AARRR воронки очень важно следить за качеством аудитории. Не забывайте, что на выходе вас интересует доход, а не просто 100500 пользователей, которые ничего не приносят
В зависимости от канала и правильного таргетинга к вам будет приходить разная аудитория.
- Определитесь со своей целевой аудиторией.
- Посмотрите в каких каналах ее можно собрать (контекстная, баннерная реклама, социальные сети, блоггеры и т.д.).
- Тестируйте каждый канал и следите за качеством аудитории (сколько времени пользуются продуктом, возвращаются или нет, совершают ли покупки, кладут заказы в корзину).
- Оставьте только те каналы, которые приносят вам качественную аудиторию (ту, что приносит доход).
Как мерить: ctr объявлений, стоимость кликов, качество трафика по каналам (конверсия в целевое действие), кол-во новых пользователей.
На этом шаге важно четко понимать, что именно должен сделать пользователь. Нажать кнопку, оставить заявку или зарегистрироваться, привязать банковскую карту и получить бесплатный период, после чего у него начнут списываться деньги (распространенная практика)
- Прорисуйте сценарий пользователя внутри вашего продукта.
- Посмотрите, сколько шагов ему нужно сделать, чтобы дойти до целевого действия?
- Может быть их можно сократить?
- На каком именно шаге он отваливается? (форма заказа, кнопка, фильтр)
- Нагенерите гипотез и проверяйте их.
Как мерить: кол-во просмотренных страниц, время на сайте, использование эл-ов интерфейса (фильтры, кнопки, навигация).
Если у вас продукт рассчитан на разовую покупку, то здорово: пришел, купил, исчез
Но, как правило, важно, чтобы пользователь возвращался и совершал повторные покупки
Как мерить: когорты retention в Google Amalytics, отток пользователей/процент вернувшихся.
Ну просто шикарно: и привлекли, и активировали, и даже вернули после первой покупки, дело сделано. Да не тут-то было!
Если пользователь к вам лоялен, то он может и другим про вас рассказать. Порекомендовать, что-то посоветовать или даже отстоять ваш продукт в какой-то переписке соц.сетей. Это и есть referral, то есть готовность рекомендовать вас. Так вы получаете новых пользователей за счет существующих.
Как мерить: опрос на удовлетворенность (NPS), активность и рекомендации в соц.сетях, кол-во приведенных новых пользователей, узнаваемость.
Продакт менеджеру очень важно понимать, что помимо пользовательских метрик, существуют еще бизнес показатели. Те самые, благодаря которым, продукт создается и развивается
Данный шаг воронки AARRR позволяет понять, а приносит ли то, что мы делаем должный доход. Сходится ли бизнес модель?
- Посмотрите на время, которое тратит пользователь от момента входа в продукт до целевого действия.
- Есть ли какие-то барьеры? Почему не оплатил?
- Может не перезвонили?
- Если купил, может еще что-то предложить вдогонку?
- Сегментируйте свою аудиторию в зависимости от дохода и проанализируйте воронку ля каждого сегмента.
Как мерить: кол-во заявок, покупок, заказов, оплат, стоимость привлечения клиента (CAC), конверсии перехода из бесплатной версии в платную, время до первого заказа, средний чек (ARPU), LTV.
Доход от продукта (Revenue)
Показатель успешности проекта на данном этапе — прибыль. Потенциальные клиенты превращаются в реальных и совершают покупку.
Метрики для мобильных приложений:
- ARPD — средний доход от одной загрузки;
- ARPU — средний ежемесячный доход в расчёте на одного пользователя;
- ARPPU — средний доход на одного пользователя с платной подпиской;
- LTV — совокупный доход на одного пользователя.
Проводится работа по достижению следующих показателей:
- Высокий уровень обслуживания клиентов;
- Хорошее качество товара и услуг;
- Специальные предложения и послепродажное обслуживание.
Бесплатное обучение маркетингу от Edugusarov.by на 7 дней
У нас вы сможете учиться в удобном темпе, понять, как работает маркетинг, и оценить необходимость его изучения.
Попробовать бесплатно

Activation: How fast can customers find value in your service?
The goal of the activation phase is to provide an outstanding customer experience. As a result, determining the product’s AHA moment is essential.
The AHA moment happens when consumers realize the value of your service for the first time. This point determines whether your customers stay engaged or leave.
The AHA moment is a powerful emotional experience that should occur early in the customer’s journey. Remember that the longer your time to value is, the more likely people are to leave.
How to find your services’ AHA moment
To find your service’s AHA moment, first, reach out to your most valued customers and ask them what they value most.
However, keep in mind that each persona is going to have their own AHA moment.
Create a list of behaviors that are related to customer retention after reviewing customer feedback.
Feel free to use this list to define your activation metrics and keep in mind that metrics are unique to each service and differ from one another.
Examine if customers who use your service regularly
- complete the onboarding process,
- interact with the main feature,
- get in touch with other customers.
It should be obvious where customers find value in your service once you combine customer feedback with analytics data.
Onboarding is one of the most effective ways to quickly get consumers to an AHA moment.
Well I know you’ll ask ‘’how?’’
Simple: get the user onboarding process right.
Questions to answer in the activation phase:
- What can you do to give your customers an unforgettable experience?
- How quickly can consumers recognize the value of your service?
- What do customers value most about your service?
- What steps should an ideal customer take?
- What are the habits that are linked to consumer loyalty?
- What does activation mean for your service?
Metrics to measure in the activation phase:
- How many customers used a key product feature?
- Time to value
- Visitors to registration ratio
- Conversion rate
- How many customers have an “Aha!” moment?
- Dwell time + viewed pages
- Drop-off rate
What are AARRR metrics?
The AARRR framework is one of the most popular models for Start-ups and SaaS companies to measure growth and success. It was introduced by David McClure, founder of Practical Venture Capital, and is also called the Pirate Metrics or Pirate Framework. It splits your customer life cycle into 5 phases and matches them with related metrics – starting from the first touch point up to the point, a potential customer becomes a paying customer. This will give you a clear insight into which parts of the customer life cycle are performing well and where you have potential to improve your conversion funnel.
What does AARRR stand for?
AARRR stands for the 5 phases in your customer life cycle. These are:• Acquisition: Where are customers coming from?• Activation: How to turn acquired customers into active customers.• Retention: How to make potential customers come back.• Referral: How to get customers to recommend your service.• Revenue: How to turn potential customers into paying customers.
Let’s break down a typical customer life cycle of a SaaS company offering a fitness app.
Acquisition phase:
A potential customer reads your fitness blog and finds value in your app. The potential customer then opens the app store and navigates to your app.
Activation phase:
The potential customer downloads the app and completes the onboarding process.
Retention phase:
The potential customer opens and uses your app in the first month more than 10 times.
Referral phase:
The potential customer refers your app to at least one friend.
Revenue phase:
The potential customer becomes a paying customer.Lets dive deeper into the 5 stages.








Frequently Asked Questions
What is a Pirate Funnel?
The AARRR framework is one of the most widely used models for measuring growth and success in startups and SaaS businesses that divides the customer life cycle into six phases and correlates them with relevant metrics, beginning with the first point of contact and finishing when a potential customer becomes a paying customer.
Why use a Pirate Funnel?
Because you’ll see the biggest bottlenecks with a Pirate Funnel, you’ll know where to focus your time and effort. As a result, for most growth hackers, it’s a great place to start.
What does the abbreviation AARRR / AAARRR stand for?
These are the first letter of every step of the Pirate Funnel: Awareness, Acquisition, Activation, Retention, Referral, Revenue.
Задача приоритизации
Возьмём для примера типичную ситуацию, с которой сталкивается любая продуктовая фирма. Бэклог полон интересными идеями, предложенными различными сторонами:
- Важным клиентам срочно что-то нужно
- Служба поддержки считает, что нечто упростит их работу
- Разработчики предлагают изменить архитектуру, чтобы повысить качество продукта
- Члены правления полагают, что нечто поможет им завоевать новый рынок
Некоторые инструменты приоритизации помогут вам сфокусироваться на самых важных идеях. Эти инструменты можно разделить на:
Диаграммы приоритизации — графические диаграммы, помогающие быстро проанализировать идеи.
Инструменты подсчета баллов — системы показателей, которые учитывают различные факторы и их важность и подсчитывают конечный балл приоритета.
Далее мы обсудим оба типа моделей приоритизации. Какой тип предпочесть? Здравый смысл подсказывает, что начать стоит с простой диаграммы приоритизации и затем переходить к инструменту подсчета баллов, учитывающему множество данных.
Пиратские метрики: как создать email-кампанию по принципу AARRR. Часть 3 +8
- 04.11.15 11:47
•
lol_wat
•
#270143
•
Хабрахабр
•
Перевод
•
•
Блог компании Pechkin-mail.ru, Верстка писем
Рекомендация: подборка платных и бесплатных курсов Smm — https://katalog-kursov.ru/
Этап удержания (и возвращения пользователей) и триггерная рассылка
Определяем основные поведенческие триггеры
Startup Class
Как измерить удержание
- CE = Количество клиентов на конец периода (customers at the end of a period)
- CN = Количество клиентов новых клиентов, появившихся за период (new customers)
- CS = Количество клиентов на начало периода (customers at the start of a period)
Три способа увеличить удержание клиентов
- Найдите правильного пользователя. Хотите верьте, хотите нет, но удержание начинается с этапа привлечения. Если вы привлекаете правильных пользователей, они совершенно естественно извлекают максимум выгоды из вашего ценностного предложения. Если ваш процент удержания низкий, вы, наверное, привлекаете «неправильных» пользователей. Определите характеристики идеального для вас пользователя и используйте их характеристики для оценки качества вашего этапа привлечения.
- Придумайте невероятную онбординг-стратегию. Проследите, чтобы ваши новые клиенты пользовались вашим продуктом – это поможет вам на этапе удержания по модели «пиратской» воронки. Ваши пользователи активированы? Знают ли они о преимуществах вашего продукта (перед продуктами конкурентов)? Пользуются ли они ими? Если нет, будет трудно с помощью писем убедить пользователей остаться верными вашему продукту. Стратегии удержания добавляют ценности вашему продукту (это дополнительный бонус!), однако если клиенты упустили основную ценность продукта – значит, одним только бонусом тут не обойтись.
- Не позволяйте клиентам забыть о вас. Лучшие стратегии удержания продолжают решать проблемы своих клиентов долгое время после того, как те начали пользоваться продуктом. Вовлекая пользователей в процесс постоянного и непрекращающегося обучения в форме видеоуроков, вебинаров, слайдшоу, электронных книг, постов в блоге и других вещей, вы сможете убедиться, что ваши клиенты не забывают о вас. Однако помните: необходимо отправлять вашим пользователям актуальный контент, имеющий практическую ценность. Клиенты, которые найдут для себя ценность в ваших письмах, отплатят вам верностью продукту.
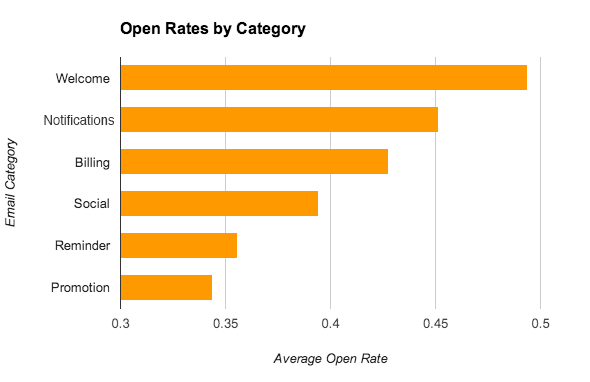
Семь работающих стратегий удержания в письмах
1. Уведомления
Письмо от Twitter о «новом подписчике» – так называемая «хорошая новость»
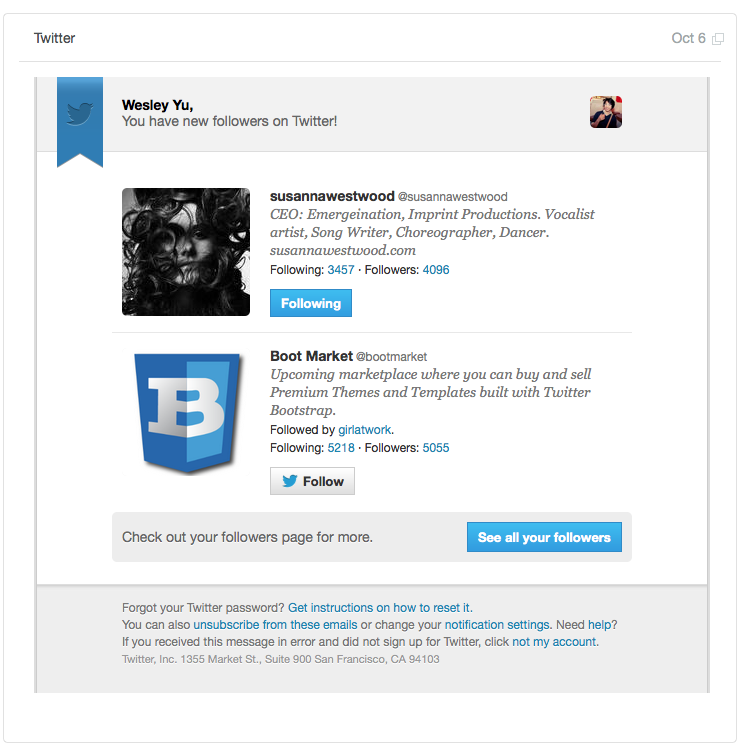
- Напоминает пользователю о Twitter
- Позволяет пользователю подписаться на обновления от новых людей
- Возвращает пользователя к взаимодействию с Twitter
- Создает положительный пользовательский опыт, так как в письме есть «хорошие новости»

Определите действия пользователей, после которых вы будете отправлять уведомления
3. Обучающие письма
Ознакомление с конкретными функциями (особенностями вашего продукта)

Образовательный контент на темы, косвенно связанные с вашим продуктом
Typecast
Письмо о продлении пробного периода
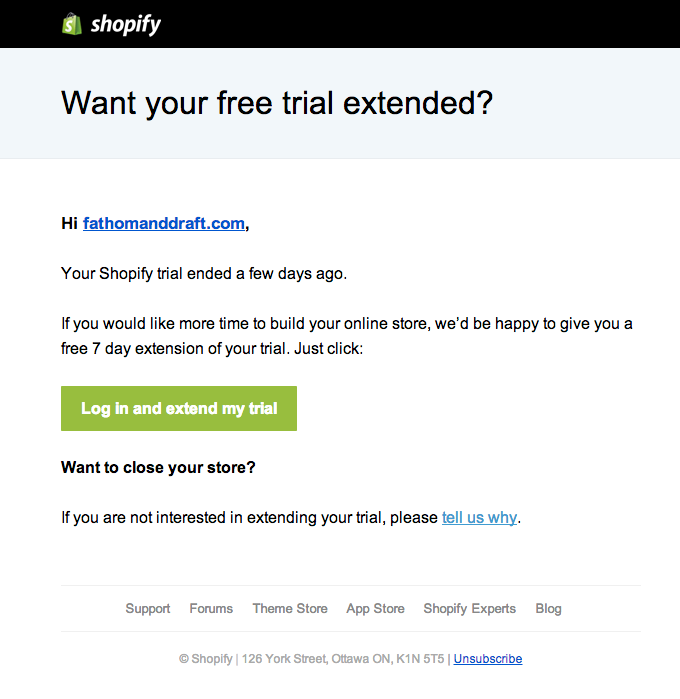
Письма о брошенной корзине
исследованию Baymard Instituteсообщает
- Не устраивает цена;
- Не доверяют компании;
- Не имеют острой необходимости покупать.
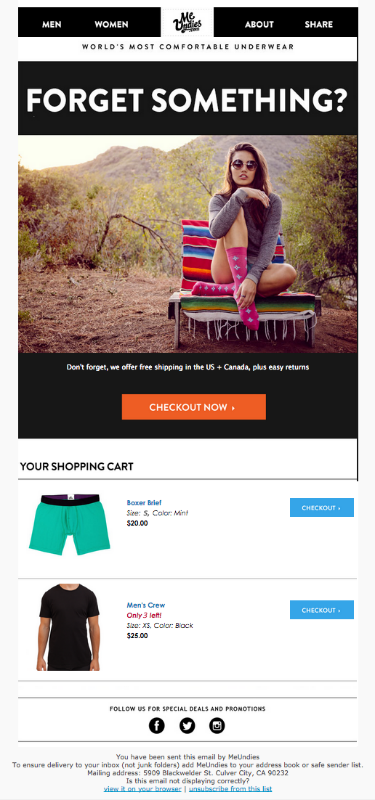 Meundies
6. Письма-опросы (индекс потребительской лояльности)
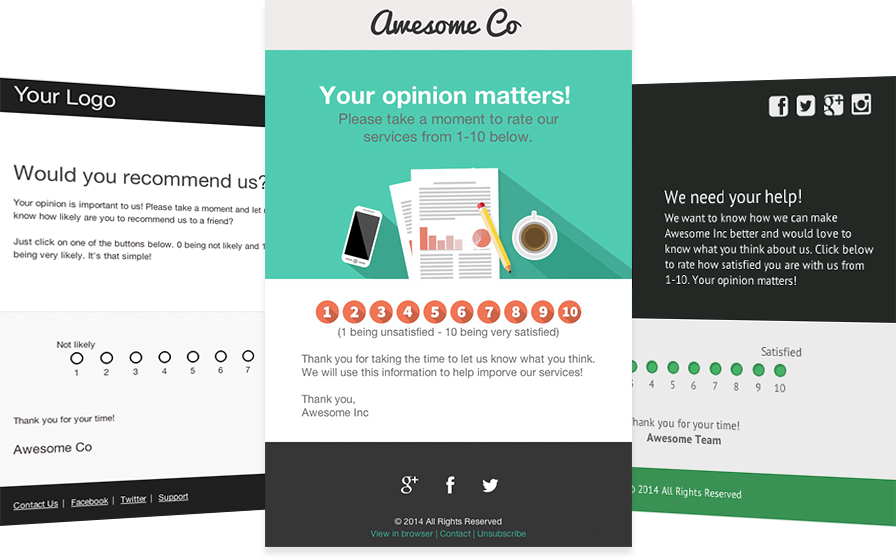
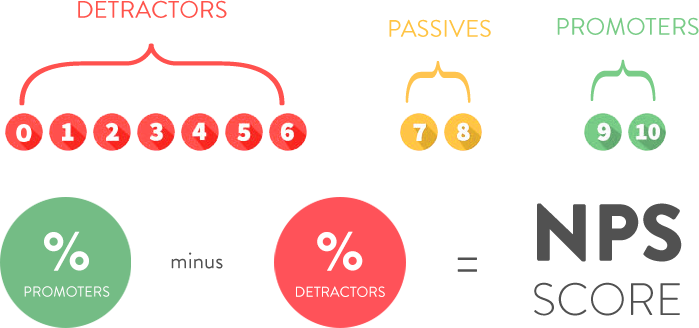
- Предсказывать, как клиент поведет себя в будущем;
- Узнать непосредственно от клиентов, что именно они думают о вашем продукте;
- Остановить отток клиентов.
7. Обзоры

К сожалению, не доступен сервер mySQL
How to build an AARRR pirate funnel
So you’re sold on the AARRR framework, how do you get started?
It all starts with how you track user behavior in your product. While you can use Google Analytics to track some pirate metrics, it’s best to use a product analytics tool like PostHog, Amplitude or Mixpanel.
1. Acquisition
- How many users signed up?
- How many people downloaded the app?
- How many users hit the landing page?
- How many people signed up to a newsletter?
- How many unique users visited the website?
- How many users viewed a product listing?
- Signup conversion rate
Acquisition is probably the easiest metric to define, but what you track will depend on what kind of product you’re building.
For an e-commerce website, overall unique users is an important metric, but user signups is better for B2B products.
It may also be prudent to add a quality metric here, too. Tracking signups based on an ideal customer profile (ICP) can be important to avoid over optimizing for the wrong kind of new users.
2. Activation
- New users who complete a specific action in their first week
- New users who engage with your core feature
- New users who complete the onboarding process
- New users who enable a third-party integration
- New users who spend x minutes using the product/website
Some users create accounts but never use your product. Tracking activation helps you isolate onboarding issues from long term retention issues.
Don’t be afraid to go deep here. Good activation metrics capture the «aha» moment a user has when they get value from your product.
3. Retention
- Activated users who came back within n-days/weeks/months
- How often activated users come back and perform an action
Retention is one of the most important metrics in any business. If you nail activation and retention, it’s a good sign you have a product people value.
For most products, measuring retention means defining a usage interval – i.e. how often you expect your retention event to occur. Do you expect users to come back every day, week or month.
You can also track unbounded retention, where you track if/how often users return without a specific interval.
4. Revenue
- Monthly recurring revenue (MRR)
- Annual recurring revenue (ARR)
- Average basket value (ABV)
- Average revenue per user (ARPU) or per account (ARPA)
What you track here will depend on your business.
Monthly recurring revenue (MRR) is good for a B2B SaaS products. B2C companies businesses may prefer average revenue per user (ARPU), while e-commerce platforms might prefer Average Basket Value (ABV).
If you can imagine three or four random letters, it’s probably an acronym for a revenue metric!
5. Referral
- Users who invite their colleagues to use your product
- Users who invite their friends to download your app
- Users who submit a review of your product / app
Is there a better validation for your product than someone inviting a colleague, or a friend, to use it?
It’s a great sign that people enjoy using what you’ve built and a powerful driver for word-of-mouth growth – aka, the best kind of growth.
Referral metrics are especially important for products or services that have a growth loop – i.e. when the product experience is improved through multiple users, or when friends are using it together.
Referrals can also be both internal (more users from the same organization) or external.
Revenue: Why should customers pay for your service?
The last Pirate Metric in the AARRR conversion funnel is revenue. Customer lifetime value is one of the most important metrics in the revenue phase.
This metric describes a customer’s total revenue over the course of their lifetime.
And I also have a formula to calculate the customer lifetime value:
If your monthly average revenue per customer is 100€ and your turnover rate is 5%, your customer lifetime value is 2000€ (100 * (1/0,05)).
Make sure you don’t mix annual and monthly subscriptions. You could be lulled into a false sense of security if you do.
Customer lifetime value vs customer acquisition cost
The customer lifetime value indicates how much money you can spend on acquiring new customers.
When you compare the customer acquisition cost to the customer lifetime value, you will get a good idea of whether your company will succeed or fail.
A 3:1 consumer lifetime value to customer acquisition rate, for instance, is a good rate.
Apply the Bullseye Framework, which you already know from the acquisition phase, to find the channel with the lowest CAC and highest return.
Well, the majority of SaaS businesses depend on monthly recurring revenue (MRR). As a result, it’s essential to figure out which features and benefits would entice potential customers to pay for your service.
The Kano Model, which we discussed earlier in the acquisition phase, can help you with this too.
Define the quality of revenue and find out which customer segment is best for your company.
Not all customers are the same, and not all revenue is generated in the same way. It is important to determine which customers are the most valuable to you.
The PVP index, created by Allan Dib, the author of the 1-Page Marketing Plan, is a great framework for identifying your best customer segment.
The PVP Index assists you in identifying consumer segments that provide personal fulfillment, value your work, and generate revenue. Determine each market segment and rank them on a scale of 1 to 10 based on the PVP Index.
- Personal fulfillment: Do you enjoy working with this type of customer?
- Value: How much is your work valued in this market segment?
- Profitability: How profitable is this segment of work?
When you identify your ideal customers, you’ll be able to make better use of your marketing budget and increase the quality of your revenue.
Questions to answer in the revenue phase:
- What percentage of the customers convert to paying customers?
- What is the average order value per customer?
- How many repeat customers do I have, and how often do they make purchases?
Metrics to measure in the revenue phase:
- Customer lifetime value
- Customer acquisition cost
- Monthly recurring revenue
- How many free customers become paying customers?
- Average order value per customer
- Repeated purchases
- Revenue churn
- Expansion revenue
Корень проблемы
Если вы посмотрите на кривую удержания среднего мобильного приложения, вы увидите огромное снижение использования приложения сразу после установки.

По данным Quettra, среднее приложение теряет 77% DAU (ежедневных активных пользователей) в течение первых 3 дней. Через 30 дней этот показатель составляет 90%. Через 90 дней он составляет более 95%.
И с появлением все новых приложений все становится только хуже.
Представьте себе: если вы приобретете 100 пользователей через платные объявления, то через 3 дня 77 из них просто уйдет. И никогда не вернутся. Ваш CPI составлял 5 долларов. Вы просто сожгли 77 * 5 = 385 долларов США. Теперь приобретем 1000 пользователей. Через 3 дня вы сожжете $ 3,850 долларов США. Делайте это каждый месяц в течение года и приобретите 12 тысяч пользователей. Вы потеряете 46,000 долларов.
Это справедливо для Android и iOS-приложений. Если мы посмотрим на игры на двух платформах, то кривые удержания выглядят одинаково.
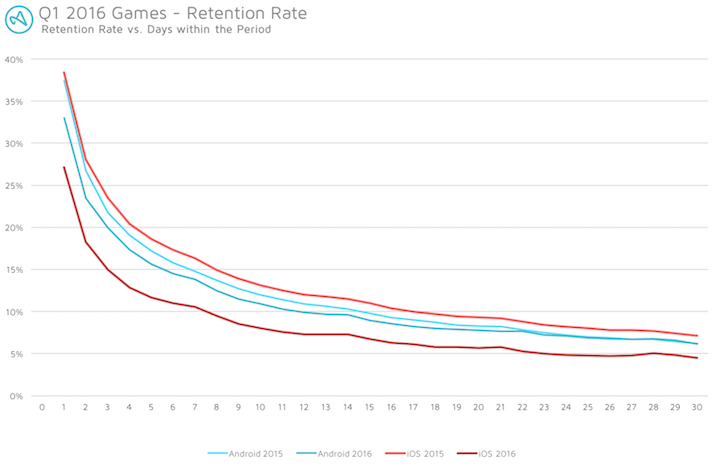
Все предельно понятно:
Но если у вас есть удержание для какого-либо сегмента пользователей, то вы сможете исправить все остальное позже.
Если мобильный стартап вкладывает время и усилия в рост, прежде, чем у него будет хорошее удержание, то это значит, что он просто арендует дорогих пользователей.
Без ROI вы просто сжигаете деньги
Вот почему важно сначала сосредоточиться на удержании, а затем перейти к активации. И сохранить привлечение на более позднего этапа
Вместо AARRR вам нужно сосредоточиться на RARRA.
Вот хорошая новость: даже небольшое улучшение активации может иметь большие результаты в удержании, главным образом потому, что эти улучшения в активации каскадно масштабируются с течением времени. Это отличный способ выпрямить кривую удержания. Звучит просто в теории, но сложнее сделать это в реальном мире. Итак, как нужно двигаться вперед, если AARRR не помогает?
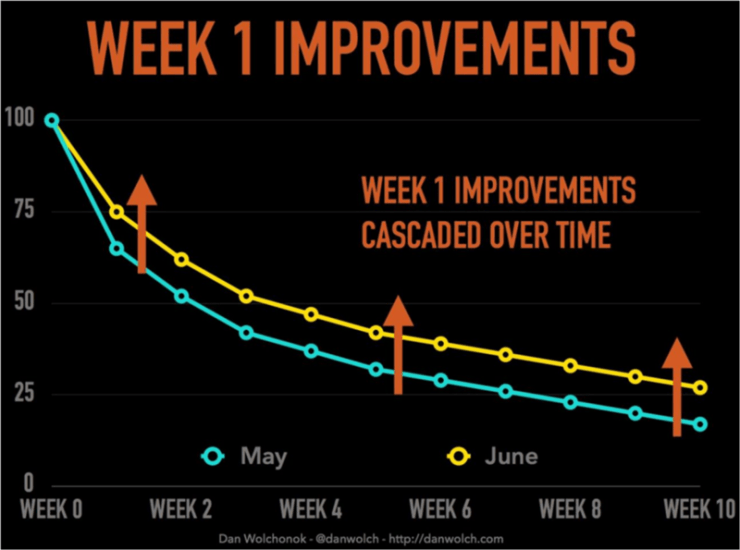
AARRR – отличная модель, не поймите меня неправильно. Она просто не подчеркивает достаточные важные точки. RARRA – намного лучший подход
Он лучше, потому что приводит вас к тому, что важно
Вот почему я люблю RARRA. Он фокусируется на основном: удержании. Легче сказать, чем сделать. Я знаю.
Вот почему мы должны сделать еще один шаг и вколоть RARRA стероиды.
Если вы нашли опечатку — выделите ее и нажмите Ctrl + Enter! Для связи с нами вы можете использовать info@apptractor.ru.
Pirate Metrics: Deep Dive
1. Acquisition
Acquisition is the first step in the pirate metrics process and where the growth funnel in this business philosophy begins.
As part of the Acquisition stage, businesses should ask themselves how consumers come into contact with their product or brand. Often, these initial contacts are made through channels such as banner ads, social media, SEO and other advertising. However, generally speaking, any means by which someone can potentially find a business or service can be considered an acquisition channel.
Unique website hits, newsletter sign ups and customer acquisition costs are some of the considerations that a business owner might wish to track in this stage of the funnel.
2. Activation
In this model, successful acquisition efforts lead to activated customers, sometimes called an “activation conversion.”
This stage is the beginning of a company’s relationship with a customer, and the value and satisfaction the company brings will determine if the relationship continues forward in the funnel.
Activation can be measured by number of users who take a particular action such as requesting more information, subscribing to a YouTube channel or buying a product.
One formula that would be valuable in this stage would be to determine conversion rate by dividing the number of activated users / customers by the total number of visitors who visited the website, etc.
3. Retention
For any business that aspires to longevity, retention is central to business success.
This is because retention is the most important indicator of the perceived value of your product or service. Depending on the price-point of your product, getting initial purchases or consumer may not be difficult – impulse purchases happen every day. However, a repeat purchase or engagement indicates that the consumer had a positive experience and that the product or service met their needs.
The methods for tracking retention can vary from business to business, but for some companies Annual Recurring Revenue, Monthly Recurring Revenue, Customer Churn, Repeat Purchase Ratio and Time Between Purchases may be ways to measure retention in a businesses customer base.
4. Referral
Referrals are one of the last parts of the pirate funnel. However, it is important to note that, in many visual depictions of the funnel, there is an arrow that circles up from the bottom back to top, Acquisition. This is because, ideally, the funnel is actually a loop, or a customer cycle, that continues to produce new customers, while retaining loyal users.
Successful referrals can be especially important because they are a less expensive means of customer acquisition than traditional marketing and, because of the influence of family and peers, they are often predisposed to brand loyalty, if those in their circle are already users.
While some measurements, like Number of Active Users Sharing Invites, can help a business begin to track referrals, there are no perfect measurements in place for this metric. In many cases, users do not indicate that they were referred or a user that is “invite” by a friend, may not become activated for months or years. Nonetheless, overall program success, reduced customer churn and ongoing growth can be indicators of a successful referral program.
5. Revenue
Revenue is often depicted last in the pirate funnel because, while money is exchanged earlier in the customer life cycle, without successful completion and measurement of the preceding steps, business’ revenue may be unreliable. If a company’s goal is growth, then rapid revenue generation is less fundamental than strong marketing and customer retention / referral efforts.
Tracking revenue effectively is critical for business success and, while awareness of overall revenue after expenses is important, it is only a fraction of the bigger picture. Evaluating revenue across many categories of users, products and services is necessary for establishing a clear picture of company success and making wise financial decisions.
Measuring revenue per user category and product line will help determine if the pricing structure is correct and if any products or services are not generating enough revenue. Only when those factors are understood can a business begin to create accurate budgets and financial projections for long-term success.
Этап 4. Формируем желание рекомендовать
Это важный этап для SMM, потому что продавать — хорошо, но недостаточно. Нужно добиваться, чтобы клиент покупал снова и рекомендовал продукт. Рекомендации и отзывы — мощный триггер для других пользователей, потому что люди доверяют опыту знакомых больше, чем чему-либо еще.
Для этого выстраиваем систему, в которой клиентам будет интересно делиться брендированной информацией у себя, на странице бренда или внешних площадках. Так мотивируем клиентов делать посевы и выступать в качестве амбассадоров или даже адвокатов бренда.
Наглядный пример в нашем портфолио — продвижение детской мебели «Бельмарко». Нам нужно было увеличить вовлечение в сообществах бренда, поэтому мы задействовали десятки механик, в том числе направленных на желание рекомендовать.
Одна из механик — конкурс на отзыв. Участникам предлагали оставить отзыв на своей странице, чтобы поучаствовать в розыгрыше призов — мебель «Бельмарко» или сладости. В результате мы получили десятки упоминаний бренда и запас отзывов на несколько месяцев вперед.


Acquisition: Where are your customers coming from?
Questions to answer in the acquisition phase:
• What keeps my customers up at night?• What motivates my customers to solve their problem?• What’s the desired future state for my customers?• How can I make potential customers find me?• How much are the CAC per marketing channel?• How many customers can I reach with this marketing channel?• Am I getting the right customers in this marketing channel?
Helpful frameworks in the acquisition phase:
• Personas = identify your target audience.• Bullseye Framework = identify marketing channels with traction and the best ROI.• PVP Index = identify the most promising market segment.• Journey Maps = identify customer touch points and the customer journey.
Metrics to measure in the acquisition phase:
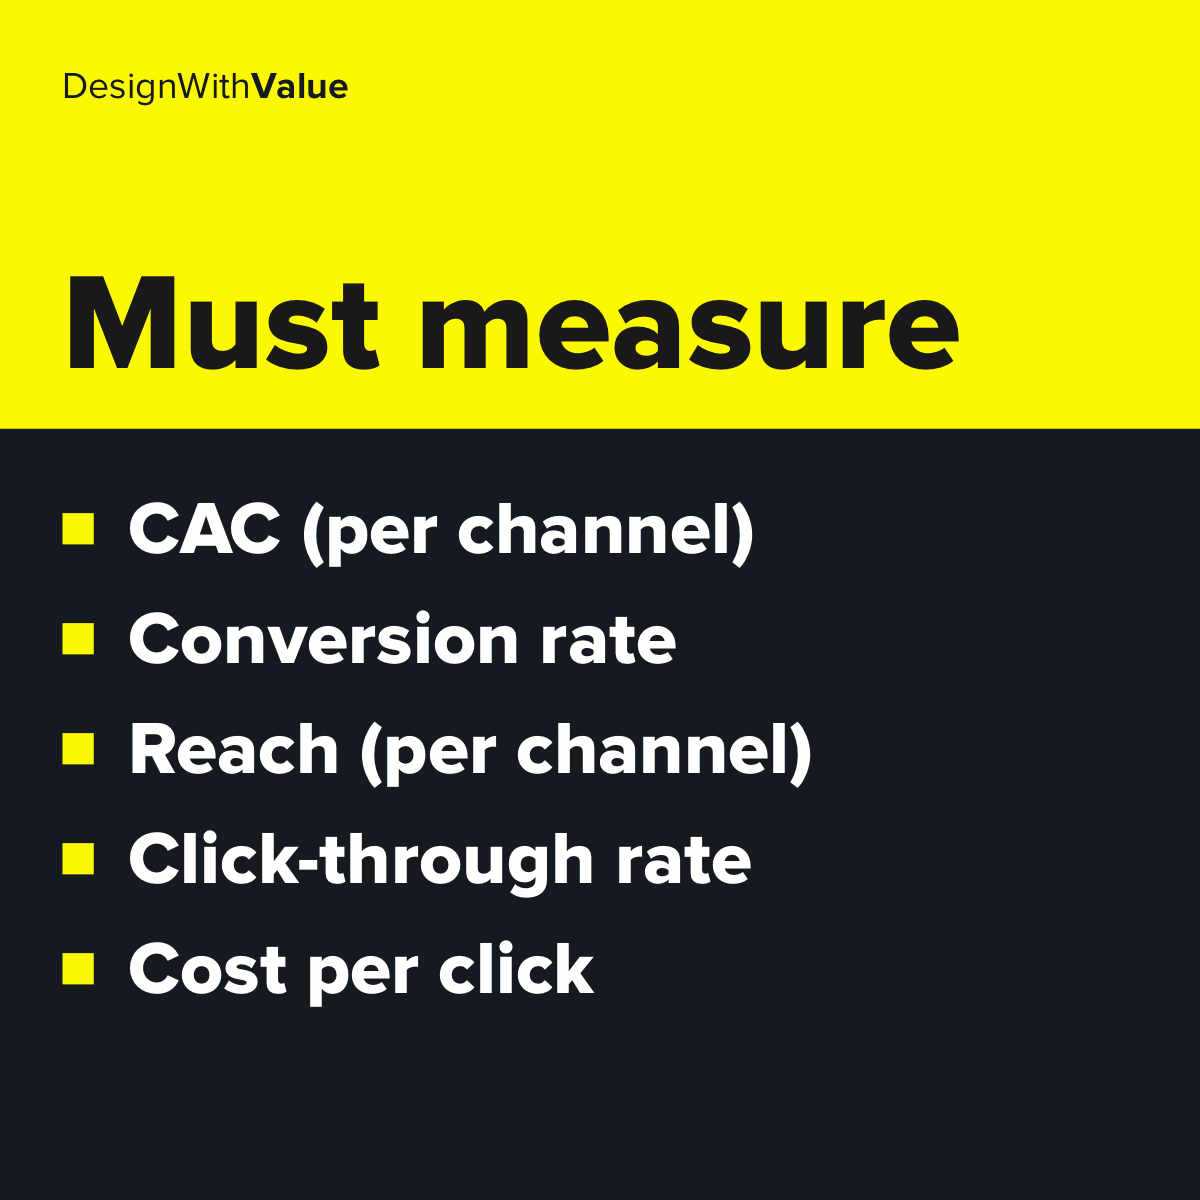
• Customer acquisition cost (per channel)• Conversion rate• Traffic driven to the website (per channel)• Click-through rate• Cost per click• Dwell time on website• Bounce rates• Quality of leads





Заключение
В этой статье мы рассмотрели различные модели приоритизации: простые базовые диаграммы и более сложные инструменты, помогающие рассчитать баллы приоритетности. Мы также обсудили применение шаблона приоритизации на практике.
Приоритизация может показаться полезным инструментом. Таковой она и является, однако некоторые сумасшедшие идеи никогда не набирают достаточно очков. Компания должна быть открыта для подобных идей и их тщательного инновационного анализа.
![]() Что дальше?
Что дальше?
- Доступ к шаблонам. Воспользуйтесь бесплатным планом BSC Designer для доступа к 30 шаблонам ССП, включая Шаблон приоритизаци из этой статьи.
- Отточите навыки. Запишитесь на тренинг по ССП. Отточите ваши навыки стратегического планирования.
- Автоматизация. Узнайте что такое софт для ССП и как он может облегчить создания стратегически карт и работу с индикаторами.


![Aarrr framework. the definitive guide to pirate metrics.[+ free worksheet]](http://susaninskaya.ru/wp-content/uploads/7/e/e/7eeba1e3a9d24900d1483cafb59586d5.jpeg)


