
LTV — что это такое
Если бы мы знали наперёд, станет ли сегодняшний клиент лояльным, или мы больше никогда его не увидим, — как здорово это знание помогло бы нашим маркетологам.
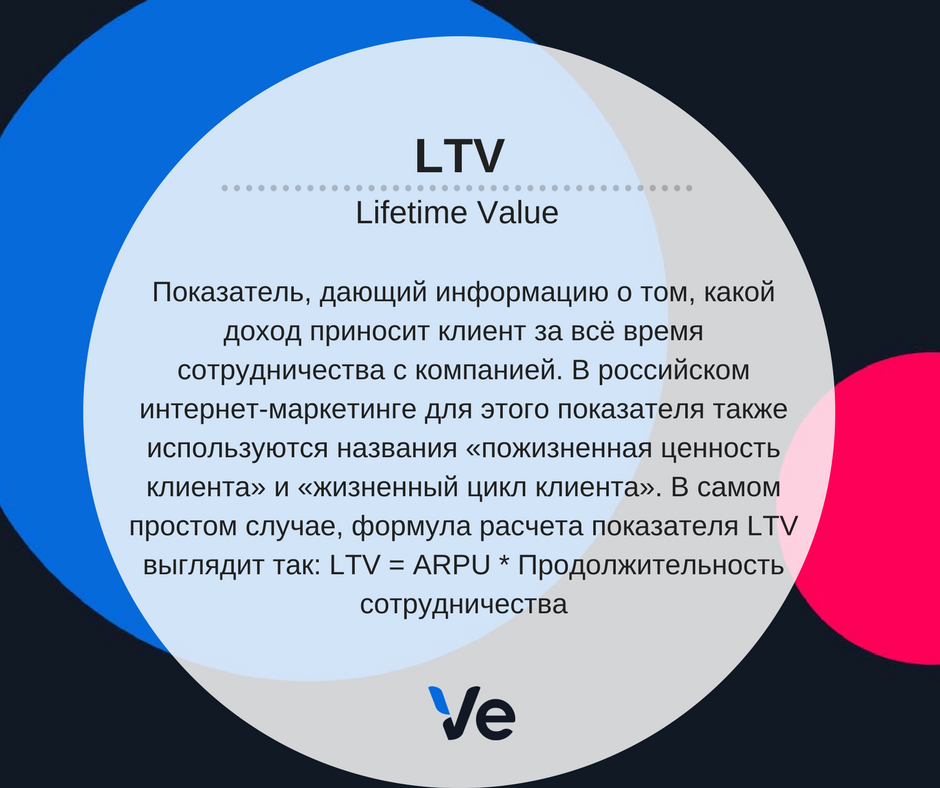
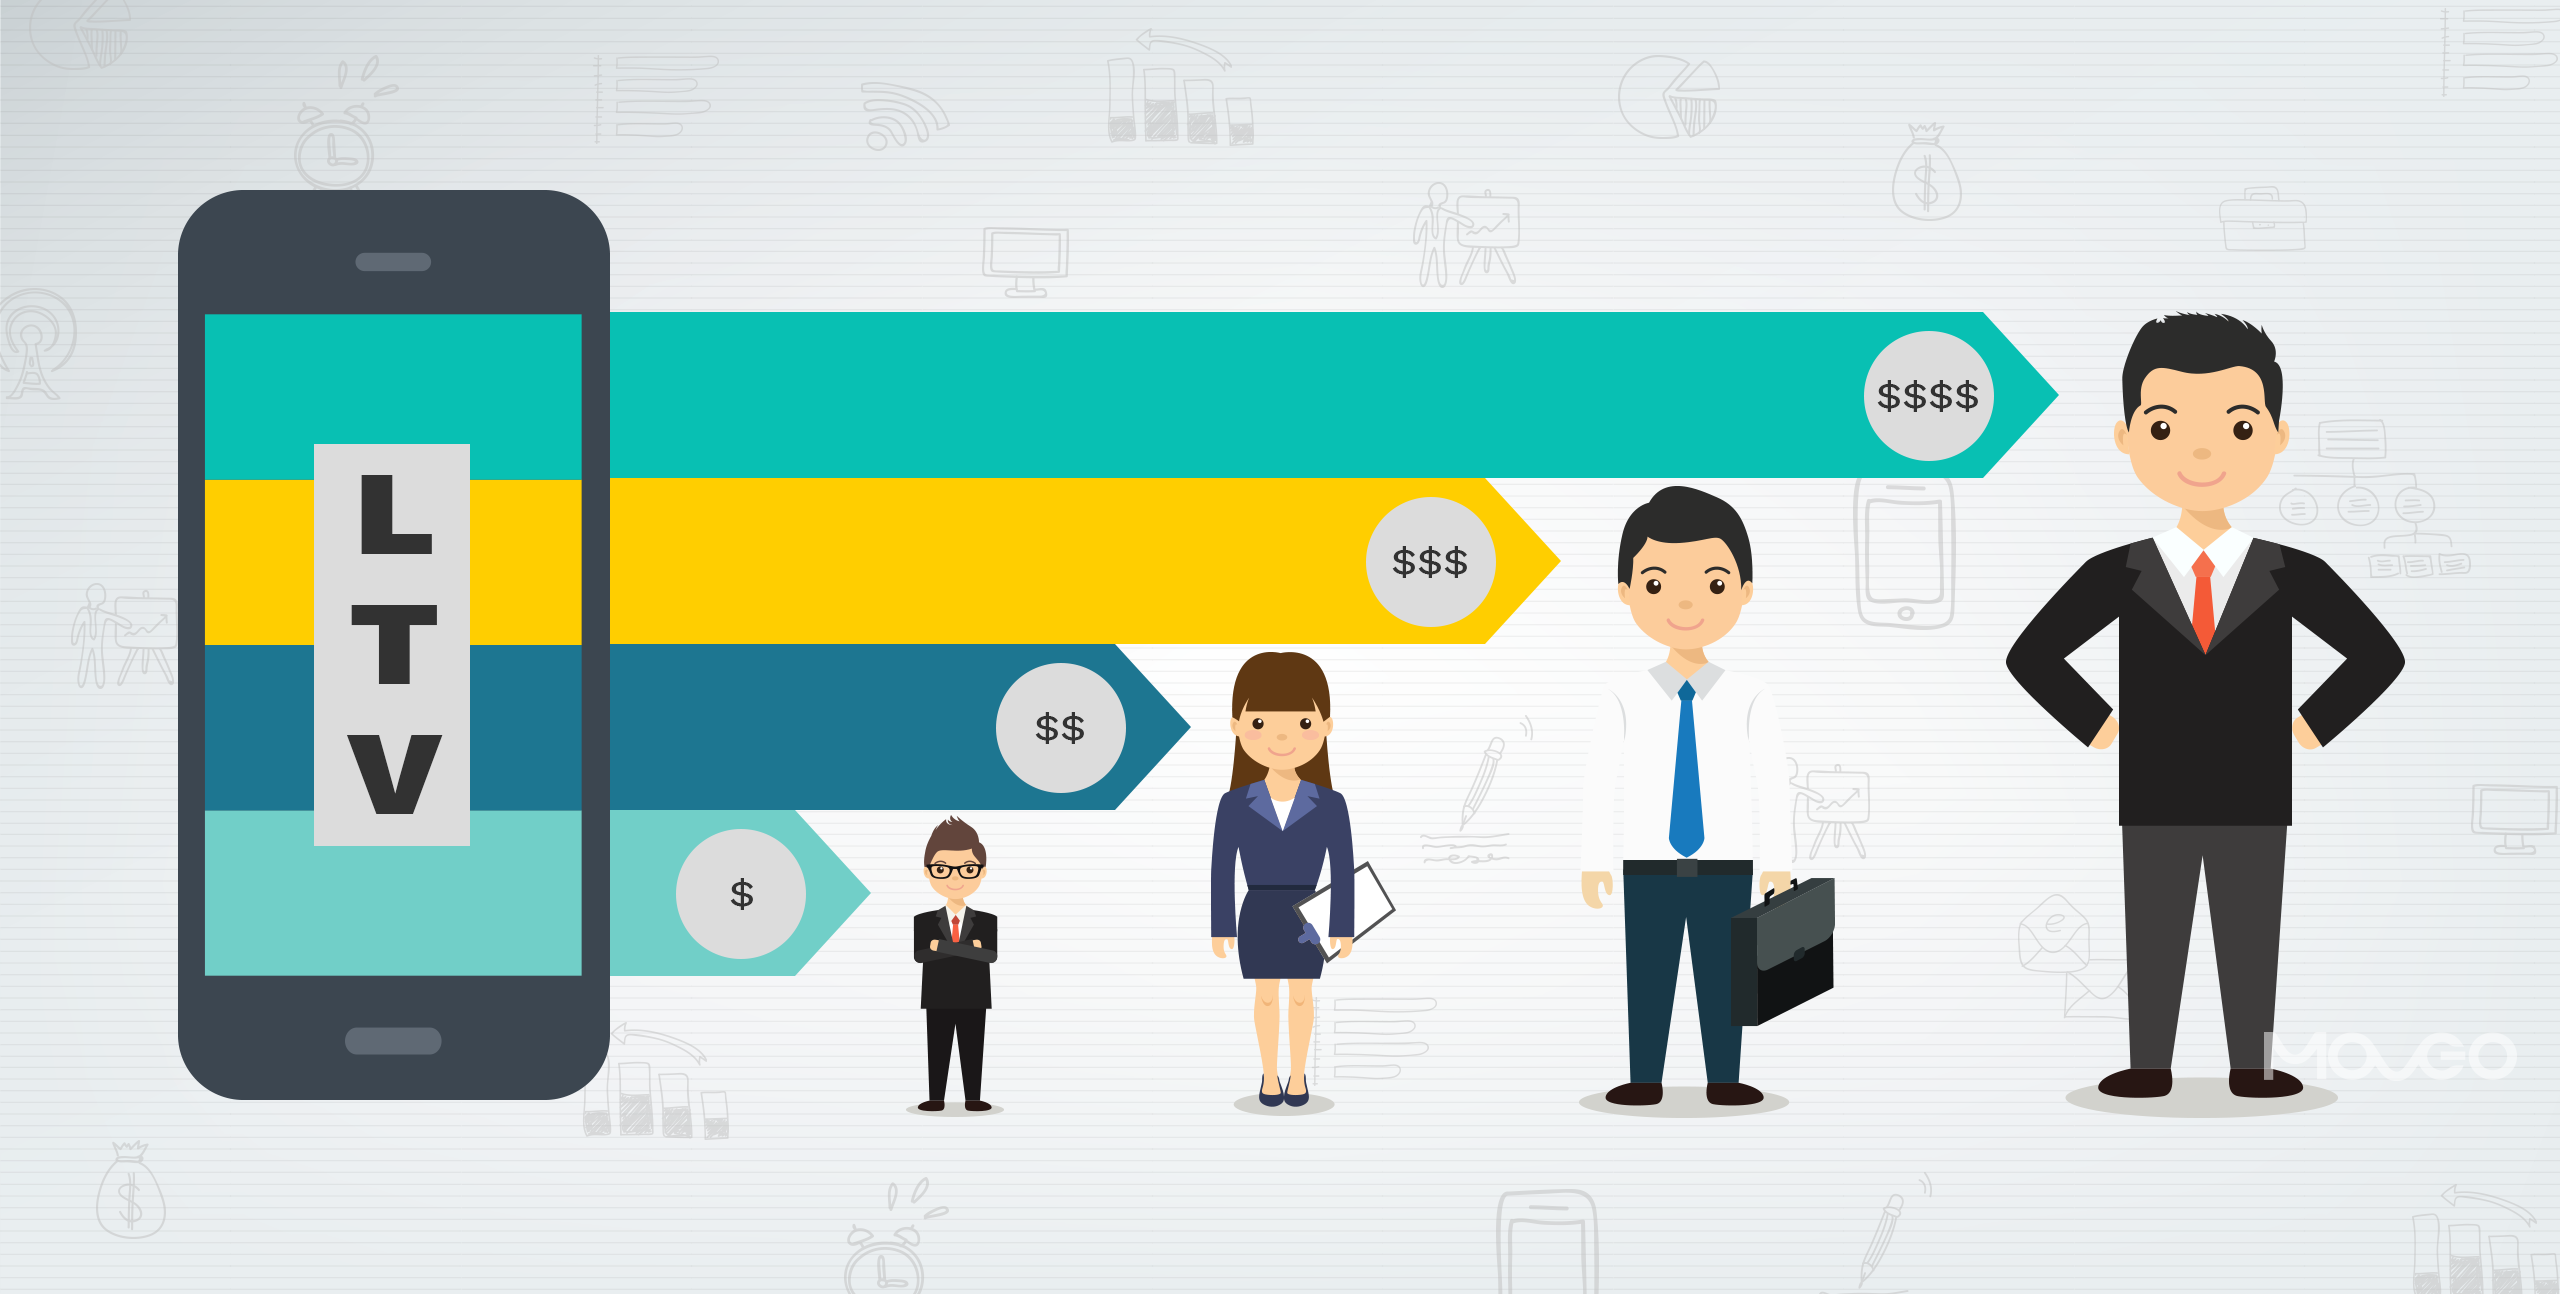
Lifetime value (LTV) — это денежная сумма, полученная от клиента на протяжении всего времени взаимодействия с ним. Задача метрики — дать основу для прогнозирования маркетинговых действий для схожих категорий клиентов. Нелояльные клиенты могут увести бюджет в минус, если разовый доход от них окажется меньше расходов, понесённых на их вовлечение. Так что же, не обслуживать таких клиентов? Вовсе нет. Проанализируйте каналы привлечения таких клиентов — перераспределите маркетинговый бюджет на более качественные каналы, проработайте вопрос лояльности — из критиков часто получаются постоянные клиенты. LTV даёт большие возможности для анализа, постановки целей и действий.
Встречаются другие названия метрики: часто можно увидеть аббревиатуры CLTV, CLV (customer lifetime value — пожизненная стоимость клиента). Разницы между названиями нет, использование любого — не ошибка.
How to Calculate Customer Lifetime Value (CLV)
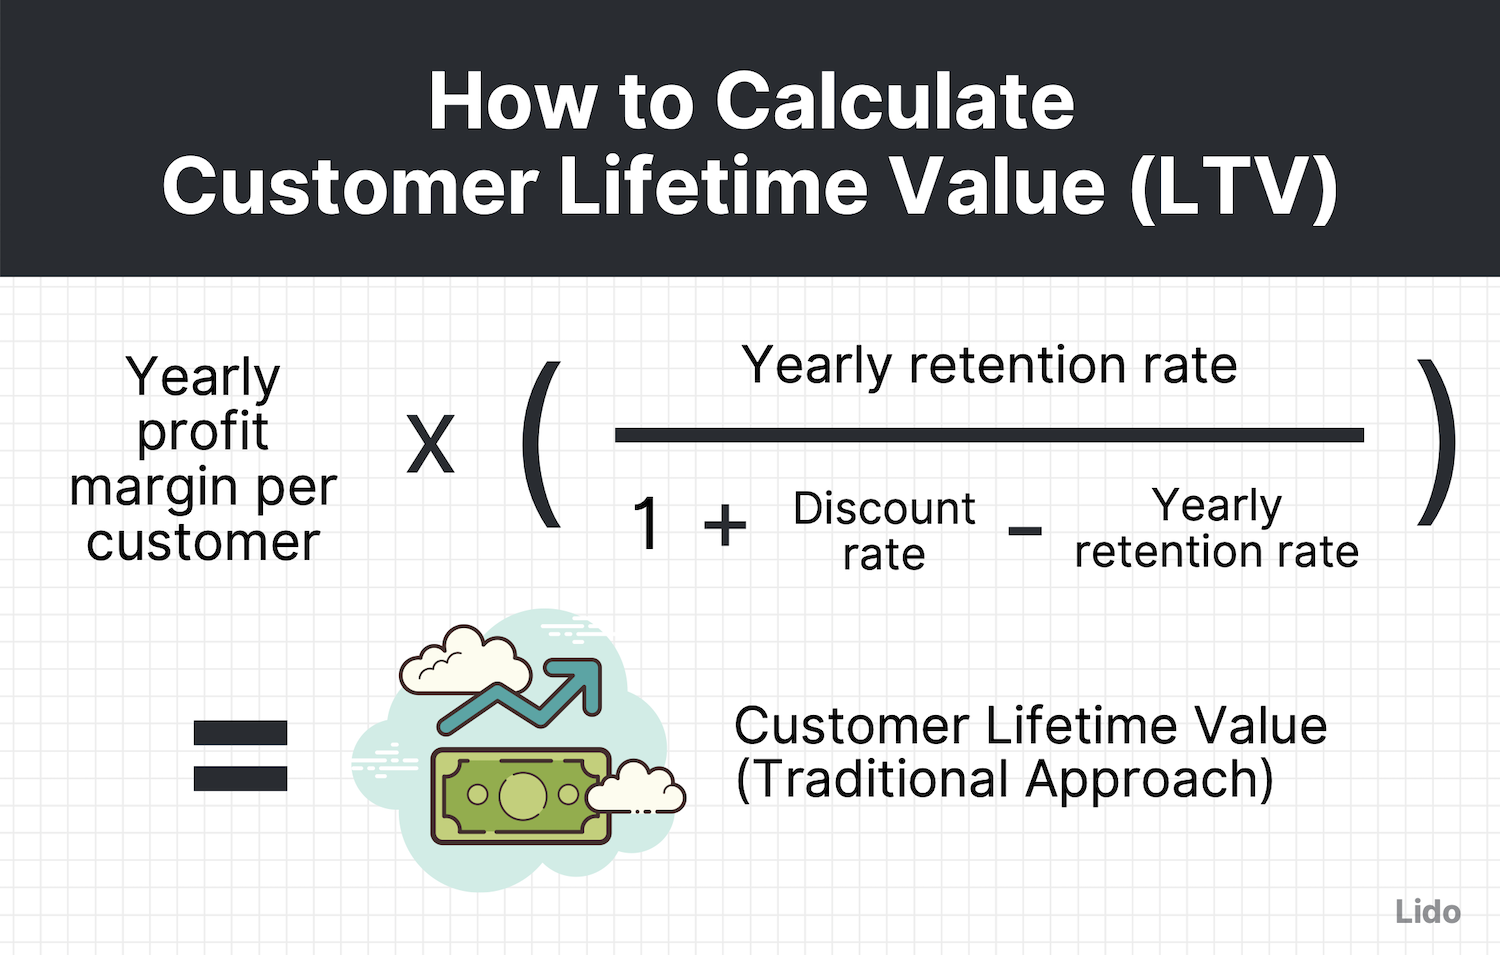
The Customer Lifetime Value (CLV) standard formula is:
This formula helps in estimating the revenue expected from an average customer over the course of their relationship with your business.
While Customer Lifetime Value (CLV) generally assesses the collective value of all customers, CLV can be applied to evaluate the business value of specific customers or customer segments.
Although this is the basic formula for calculating CLV, the process of determining this critical metric can sometimes be complex and multifaceted.
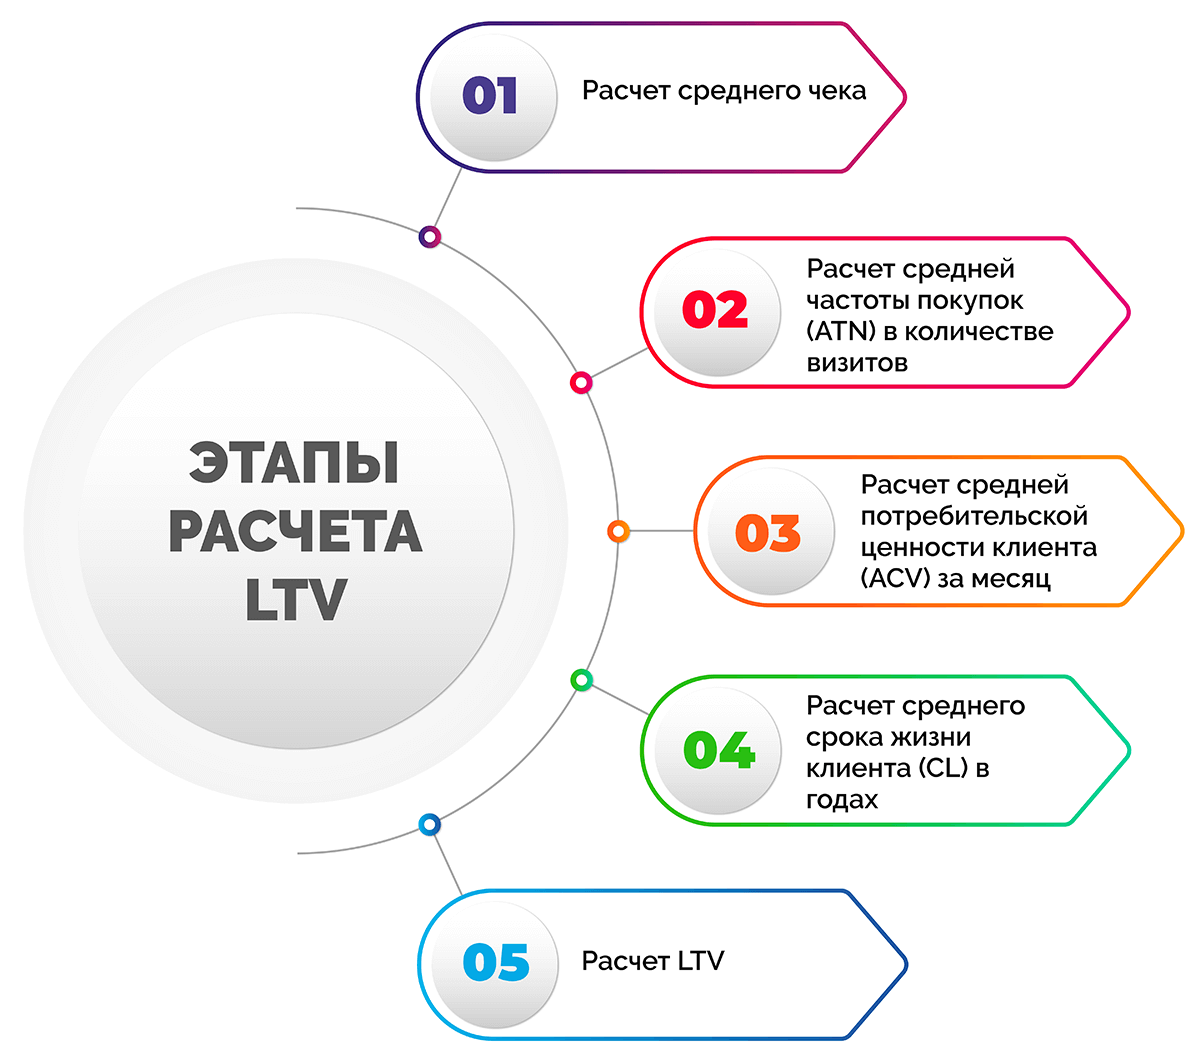
Now let’s look at the steps on how to calculate CLV:
Step 1: Calculating Average Order Value (AOV)
To find the average order value, tally up the total revenue accrued from all customer orders over a chosen time period. Then, divide this sum by the total count of orders placed. This calculation reveals the average spending per order by customers, providing insights into the revenue per transaction for your business.
Step 2: Calculating Transaction Frequency (F)
To determine the frequency of transactions, monitor the purchasing patterns of individual customers over a set period. To quantify this, divide the total number of transactions during that period by the number of customers. This will give you an average of how frequently each customer makes a purchase from your business.
Step 3: Assessing Customer Retention Duration
Evaluate the average period that customers remain engaged with your business. This involves analyzing the period from a customer’s initial purchase to their most recent transaction. Compute this average duration by considering all customers to understand how long they typically stay loyal to your business.
Step 4: The Final Formula
To calculate the Customer Lifetime Value (CLV) for a single customer, you can use two methods:
Multiply the Average Order Value by the Total Number of Transactions.
This calculation helps you understand the total revenue you can expect from a customer throughout their relationship with your business. With this insight, you can strategize ways to enhance the customer’s value, such as through loyalty programs, upselling techniques, or special combo offers, aiming to boost your business’s overall revenue.
Как улучшить показатель LTV
Мы сделали расчёты и получили результаты
Как часто бывает, о норме LTV говорить нужно с осторожностью: норма для метрики будет сильно зависеть от сферы деятельности, этапа развития компании, сезонности и огромного количества других факторов. Если рассчитывать LTV регулярно, целесообразно отслеживать динамику показателя внутри бизнеса
Ещё вариант — в сравнении с конкурентами (если обладаете нужной информацией). Вырисовывается негативная тенденция — принимаем меры; дела идут неплохо — всё равно совершенствуемся. Что предпринять бизнесу, чтобы значение LTV выросло?
Во-первых, достаточно улучшить любой показатель, входящий в расчёт LTV, чтобы результат вырос. Будь то средний чек, частота покупок или продолжительность взаимодействия с клиентом. Коммуникацию с клиентами поддержит:
-
Программа лояльности — работайте со всеми категориями клиентов. Для критиков — персональные предложения и информационный позитив, для постоянных клиентов — закрытые распродажи;
-
Ретаргетинг — создайте эффект присутствия везде, чтобы пользователь вспомнил о вас в числе первых;
-
Кросс-продажи — уместное предложение сопутствующих товаров увеличивает средний чек и воспринимается как забота о клиенте (некомплектные лампочки для светильника, батарейки для пульта).
Во-вторых, обратите внимание на улучшение клиентского опыта. Любое соприкосновение с клиентом оставляет в сознании последнего хорошее или плохое воспоминание
Если поход в ваш магазин произвёл приятное впечатление, вероятно, клиент вернётся ещё раз. Любое негативное взаимодействие грозит оказаться финальным. Улучшить клиентский опыт поможет:
-
контроль качества обслуживания;
-
обучение сотрудников;
-
сбор и анализ отзывов.
Грамотный подход к работе с негативными отзывами очистит репутацию и, в ряде случаев, обеспечит повышение лояльности недовольного клиента.
В-третьих, повысьте доступность использования вашего продукта. Особенно это актуально для электронных сервисов и приложений. Неадаптированный пользовательский интерфейс «убьёт» даже самого мотивированного клиента. Помогите пользователю адаптироваться: создайте вразумительный раздел справки, разместите обучающие ролики и всплывающие подсказки. Пусть пользователь сможет быстро добиться желаемого результата от вашего функционала.
How do you calculate LTV?
While there are a number of different options, moving from basic and simple calculations that allow you a general sense of what’s happening, to more complex, nuanced formulae that allow you to take into account the specifics of your business or niche, the goal of each one is to reflect the return on investment (ROI) of the money you spend acquiring customers and creating and delivering your services.
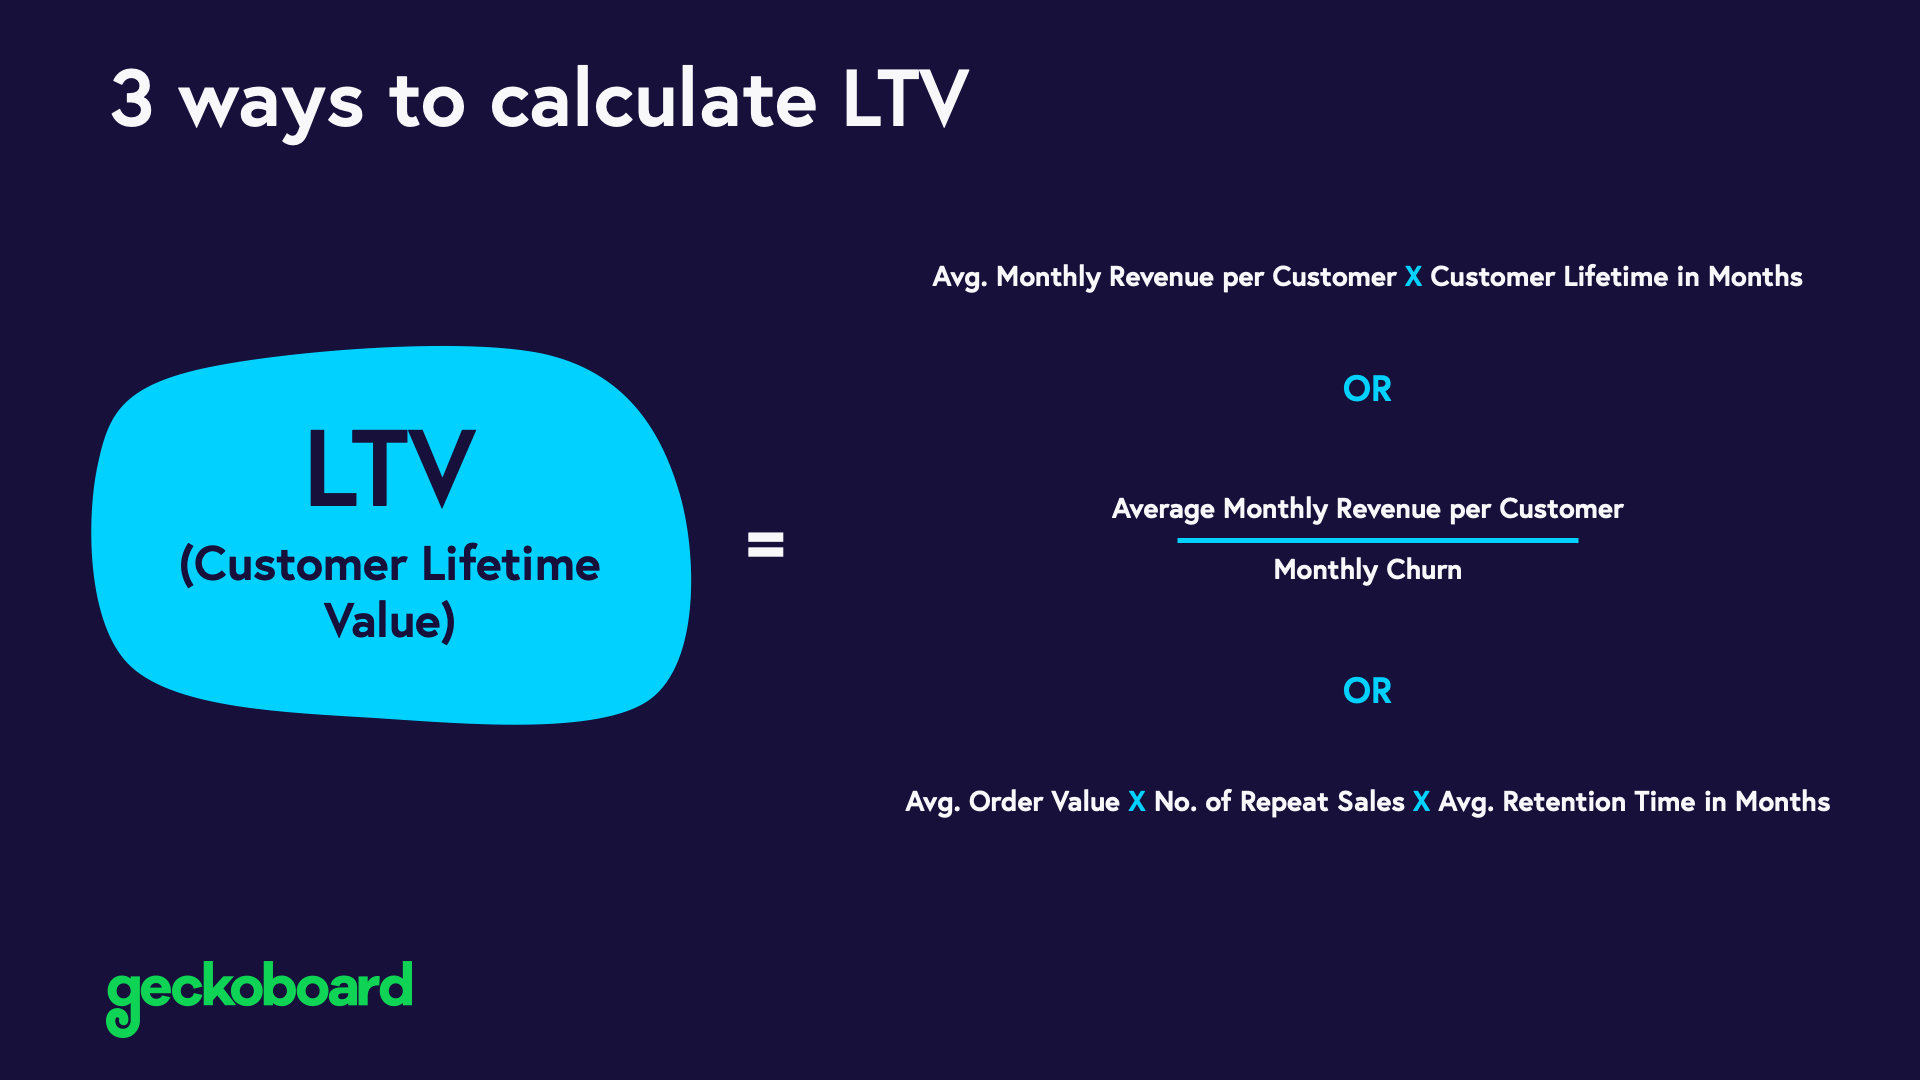
The most common options are as follows:
LTV = ARPU x average customer lifespan
So if your ARPU is $100 over a month period and your customers stay with you on average for 20 months, then your LTV would be $2000.
OR
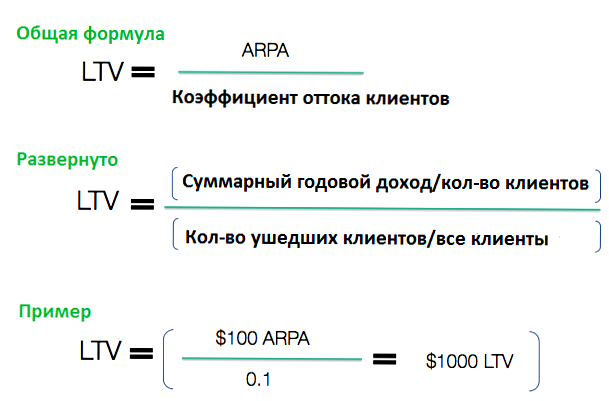
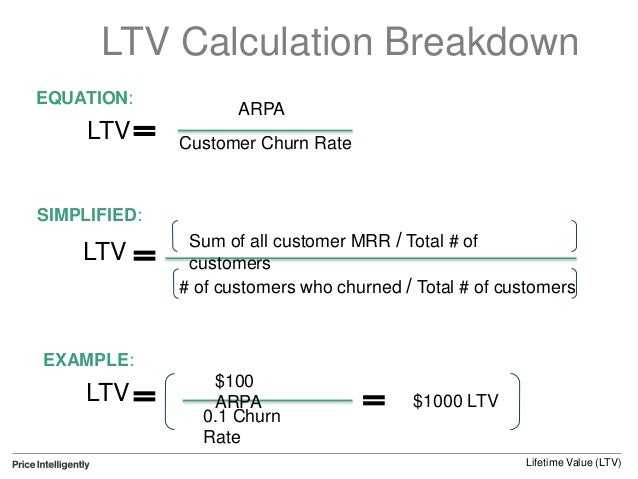
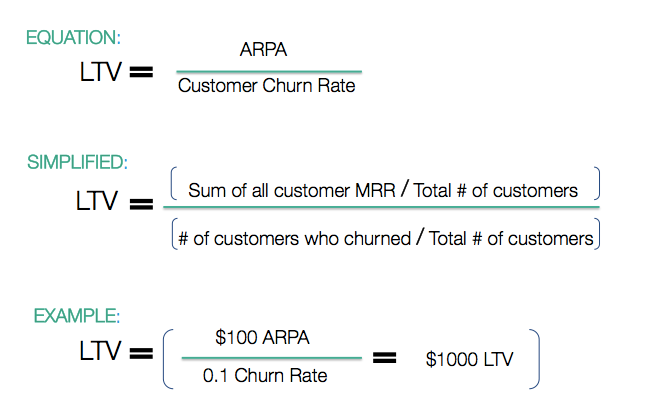
LTV = ARPU / churn rate
So if your ARPU is $100 a month and your churn rate is 0.05 (i.e. you lose 5 out of 100 customers in a month) then your LTV would be $2000.
If your churn rate is not uniform but varies widely (i.e. you have a cliff after a month of people signing up, and also a general annual churn rate) then you can consider applying a discount (of less than 1) to this equation to factor that in.
LTV = (ARPU/churn rate) x discount
Where you calculate:
ARPA = MRR/total number of accounts
Gross margin = total revenue — cost of goods (COGS)
Revenue churn rate = (revenue lost in a specific period — upsells)/revenue at beginning of the period)
A simple but less accurate approach
Okay, let’s make the following assumptions:
- AGMPU is a constant: every month a customer brings us the same amount of revenue (we can calculate it on historical data or just assume some amount)
- R is a constant: each month R % of the last month customers continue using a service or simply saying each month the constant percent (1 — R) of customers churn (we can calculate it on historical data or assume)
Assuming this, we get the following:
\begin{equation} \text{ Customer LTV = } \text{AGMPU} + \text{R}^1 * \frac{\text{AGMPU}}{\text{(1 + d)}^1} + \text{ …} + \text{R}^n * \frac{\text{AGMPU}}{\text{ (1 + d)}^n} + \text{ … = } \sum_{i=0}^∞ \text{R}^i * \frac{\text{AGMPU}}{\text{ (1 + d)}^i} \qquad \text{ (2) } \end{equation}
It means:
- In month 0 a customer brings us just AGMPU
- In month 1 a customer brings us discounted AGMPU with a probabiliy R
- In month 2 a customer brings us two times discounted AGMPU with a probabiliy R R (e.g. it was 95 % retained users in the month 1, then in month it will be 90.25 % of them)
- In month 3 …
Now look at the final formula (2) again. Wait, wait, wait. Something very familiar… Damn, this is geometric series! Common ratio is , while AGMPU is the first term of the series. It means that we can use the following formula to calculate the total sum of (3):
\begin{equation} \text{ Customer LTV = } \frac{\text{AGMPU}}{1 -\frac{\text{R}}{\text{1 + d}}} \text{ = } \frac{\text{AGMPU} * \text{(1+d)}}{\text{1 + d} — \text{R}} \qquad \text{ (3) } \end{equation}
If we didn’t discount, we would get the following very common formula:
\begin{equation} \text{ Customer LTV = } \frac{AGMPU}{1-R} = \frac{AGMPU}{\text{churn rate}} \end{equation}
Manipulations above could be also explained using an exponential decay constant, but, for me, geometric series is the clearest way. However, if you start reading some articles about LTV, you could find that some authors just mention it without any explanation.
![Customer lifetime value: the authoritative guide [updated for 2023] | daasity](https://susaninskaya.ru/wp-content/uploads/3/5/4/3543d0b0f9eaa1a4e14c0ec74fc58003.png)

Let’s look at some example. Imagine that:
- the discount rate equals 2 % (US dicount rate currently)
- every month your company loses 5 % of your old customers, then a retention rate equals 95 %
- your average monthly gross margin per user equals $50
Then your customer LTV will be the following:
\begin{equation} \text{ Customer LTV = } \frac{$50 * (1+0.02)}{(1 + 0.02) — 0.95} = $728.57 \end{equation}
Other useful recommendations regarding this approach (3):
- Some people also multiply the calculated LTV by a factor (ex. 0.75), because a churn rate could be higher in reality.
- If you try to calculate LTV for SaaS, then look here. The logic is the same, you just need to make more assumptions.
- Use the above approach (3) if you have a lack of time or data.
Common Factors Affecting Customer Lifetime Value
From all we’ve discovered so far, it should be somewhat clear that customer lifetime value isn’t a linear metric. As your organization scales, you’d pay increasing attention to factors like churn rate and brand loyalty that significantly affect customer lifetime value.
1. Churn Rate
Churn rate or rate of attrition refers to the percentage of existing customers who stop purchasing your product or using your service for one reason or the other. No matter how excellent your services and customer experience are, your business must record some percentage of churn over time. For example, if a customer experiences a dip in purchasing power, they might stop subscribing to your product.
High churn rates can upturn an organization’s customer lifetime value.
If you expect a customer to patronize your business for two years, but they drop off abruptly at the sixth month, it will have a far-reaching impact on your customer retention rate. It also means you have to invest more money in acquiring new customers to meet projected cash flow and profit.
How to Calculate Churn Rate
Churn Rate = (Total Number of Lost Customers ÷ Number of Initial Customers within the timeframe) × 100
Let’s say a business kicked off 2020 with 1,000 customers and lost 250 along the way; its churn rate is 25%.
2. Brand Loyalty
Brand loyalty is a qualitative characteristic representing the extent to which existing customers are devoted to your business. It manifests through several behaviors such as repeated patronage and word-of-mouth marketing.
Net Promoter Score and Customer Satisfaction Score are standard methods for tracking brand loyalty in an organization. If many of your customers leave positive reviews and are willing to recommend your business to others, this shows that they are loyal to your organization.
Loyal customers have a higher lifetime value because they are willing to spend more money for your business over a more extended period. A sure-fire way to boost brand loyalty is by investing in customer experience and customer satisfaction across multiple touchpoints.
Why determining your customer lifetime value (LTV) is so important
Before we get into the math, let’s talk about why figuring all of this out is so important.
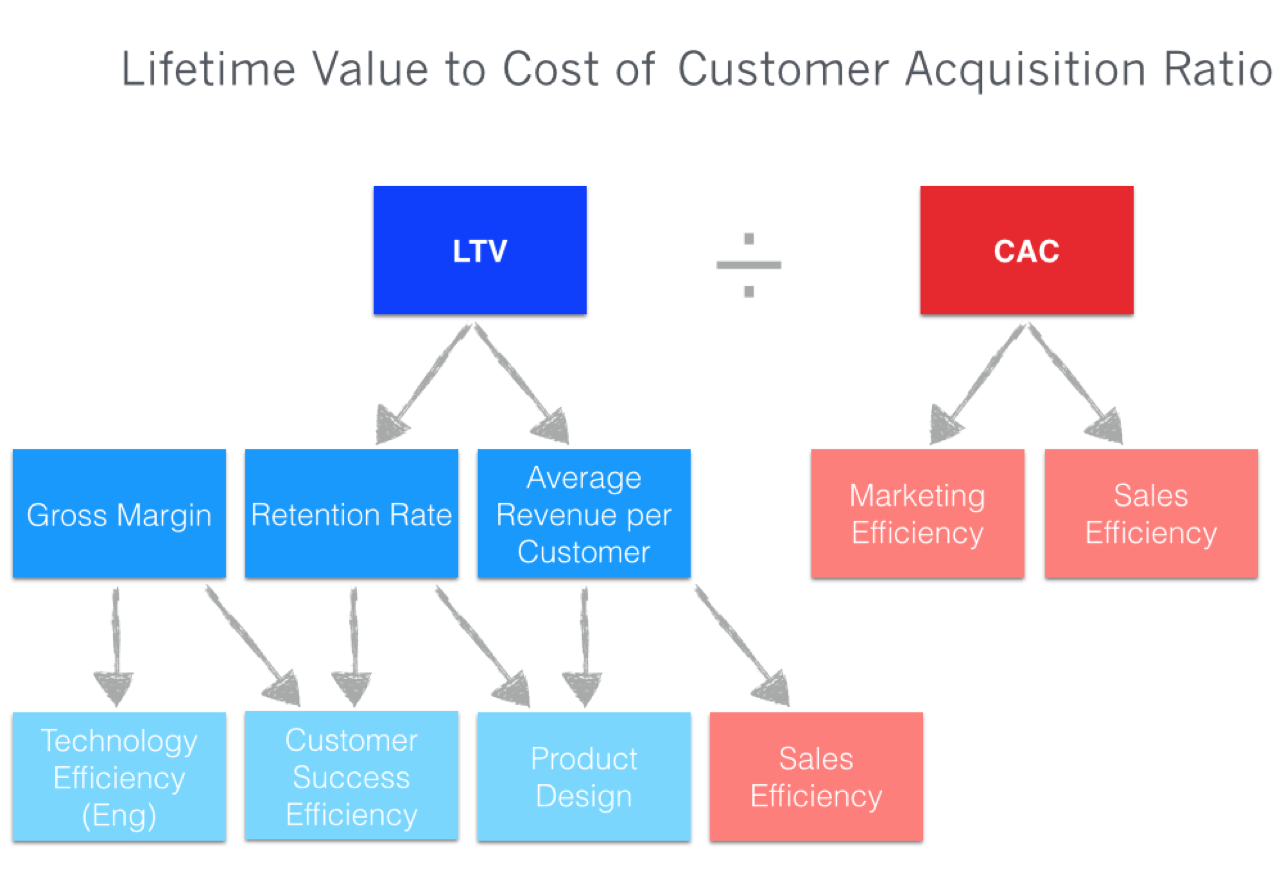
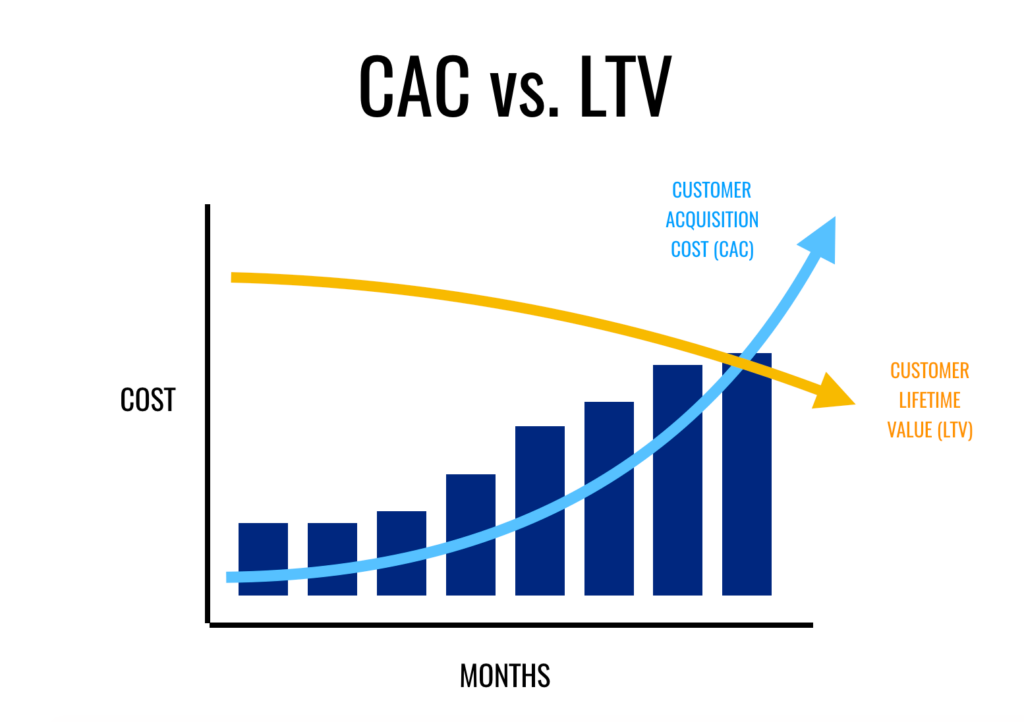
In this must-read article by venture capitalist David Skok, he says that the biggest reason startups die is because their customer acquisition costs versus their customer lifetime value often look like this:
From my experience, that’s because so many businesses focus on transactional customer value, and forget to invest in the experience that happens after the conversion.
It should go without saying that you need to invest in making the product better. But if we’re not also focusing on ways to make our existing customers happy and even marketing to people who already bought from us, the cost of acquisition can greatly outweigh how much we can make from a single customer.
In David Skok’s post, he says:
In other words, if it costs you $400 to acquire a customer you should have a plan to make $400 off of that customer within the next year to have a healthy cash flow. (This rule is less important for companies with access to lots of capital.)
This is why software companies like Salesforce might have a marketplace, where they’ll make between a revenue percentage from apps sold through their service…
…or Freedom, who partners with other companies to offer members-only perks, which likely operate the same way as an affiliate program.
The point of improving your customer lifetime value, as David points out, is to ultimately create balance in your business model that allows you to offset the unavoidable high-cost factors that inevitably go along with running your business.
He also emphasizes doing continuous optimization to build a sales and marketing machine.
Seriously—read his post when you get the chance.
What is Customer Lifetime Value (CLV)?
Customer lifetime value refers to the monetary value that a customer generates for a company based on the present value of the projected future spend from the customer relationship. It is the gross profit that a business realistically expects to generate from a single customer on the strength of their customer-business relationship.
The key metric encourages companies to focus on the long-term health of their customer relationships and not on their quarterly profits.
Customer lifetime value (CLV or CLTV) is also referred to as lifetime customer value (CLCV) or lifetime value (LTV). It helps businesses predict future revenue and measure long-term business success.
Since it involves some level of prediction, it can vary in terms of accuracy and sophistication, ranging from simple to the use of complex analytics techniques. The key metric gives you an idea of how much to invest in order to retain a customer.
Businesses use customer lifetime value to spot customer segments that generate huge gross profit. In theory, the longer a customer continues to spend on your product or service, the greater their customer lifetime value becomes.
Customer support uses this key metric to increase customer loyalty and reduce churn. Having responsive customer support representatives available to solve the problems of your customers and offer helpful recommendations is critical to keeping customers for a long period.
CLV starts from the moment a new customer makes his or her first purchase and ends when they make their last purchase and stop doing business with the company,
Customer lifetime value needs to be measured at regular intervals. Customers with high customer lifetime value are repeat customers of your brand, while those with low customer lifetime value are likely passive customers who make a one-time purchase.
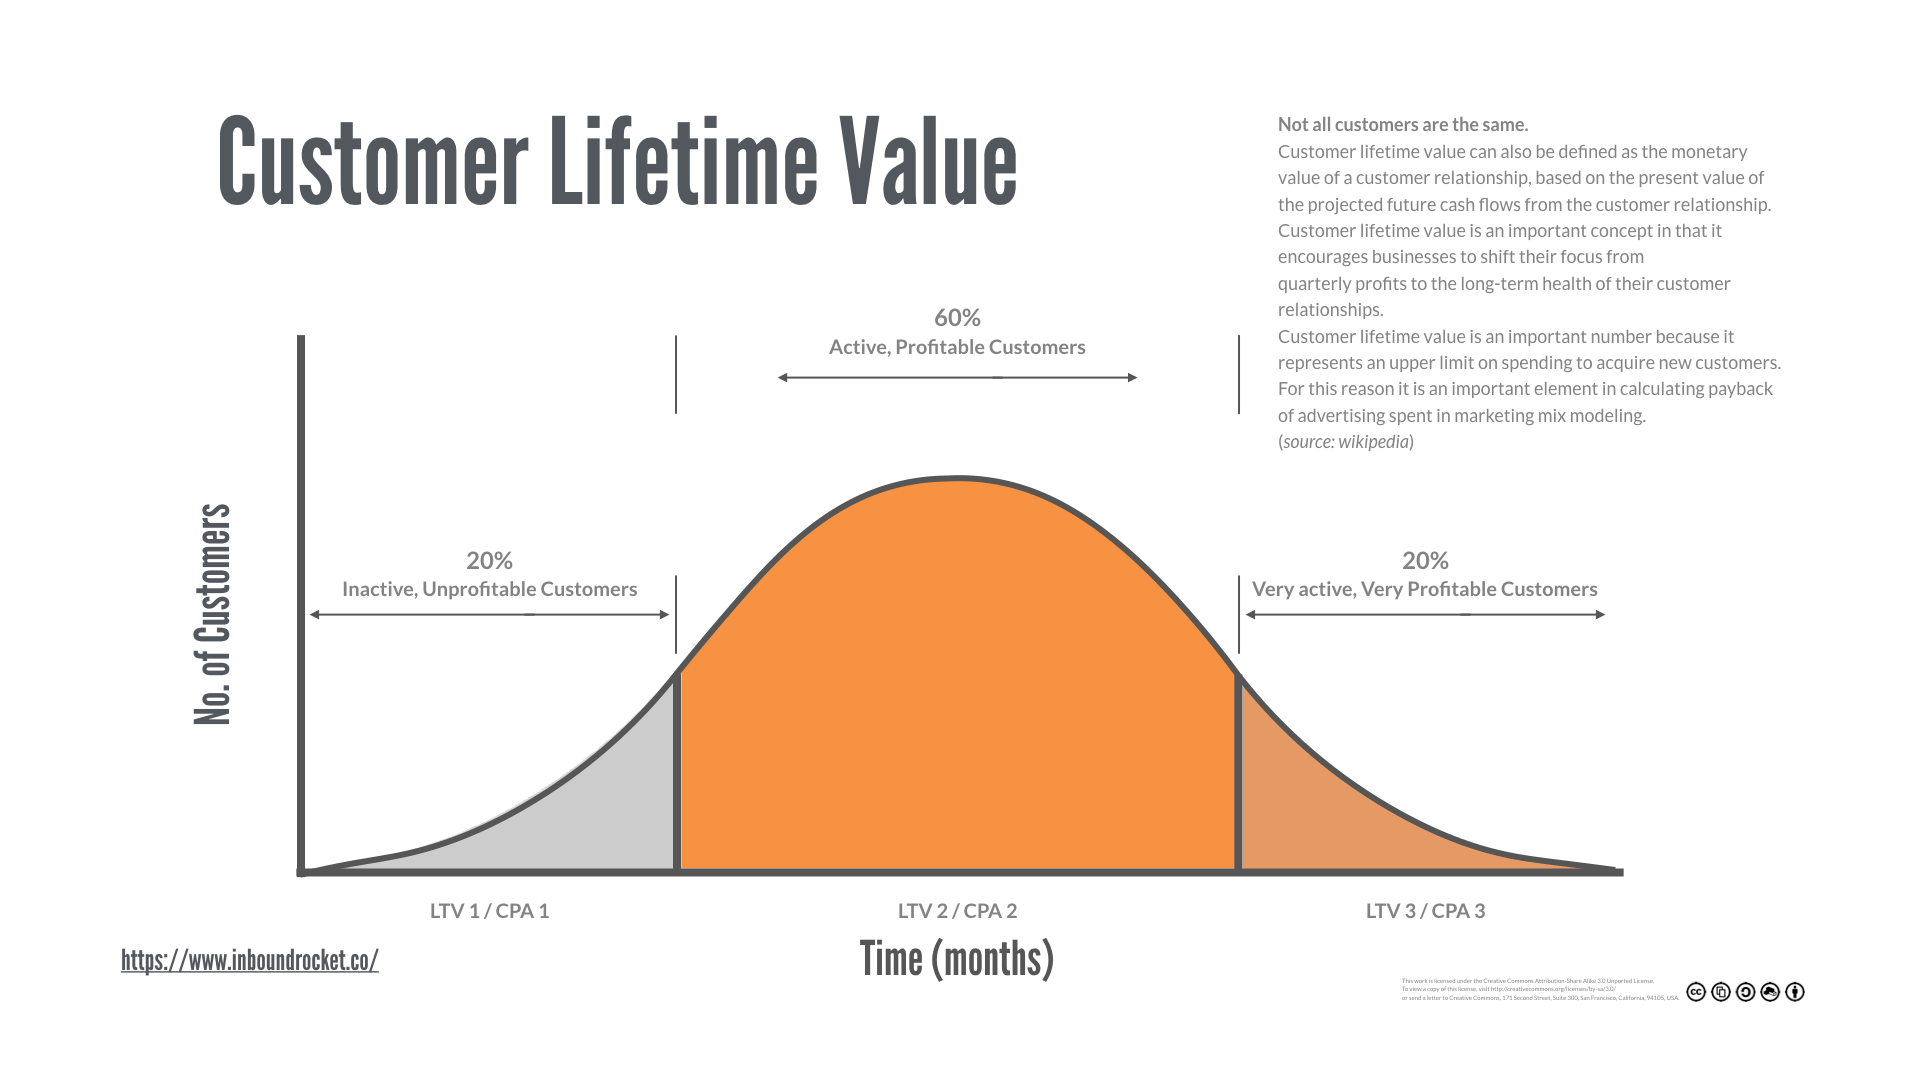
What is LTV (Lifetime Value)
The classic definition of LTV (Lifetime Value) is the gross profit an average user brings over the entire period of using a product.
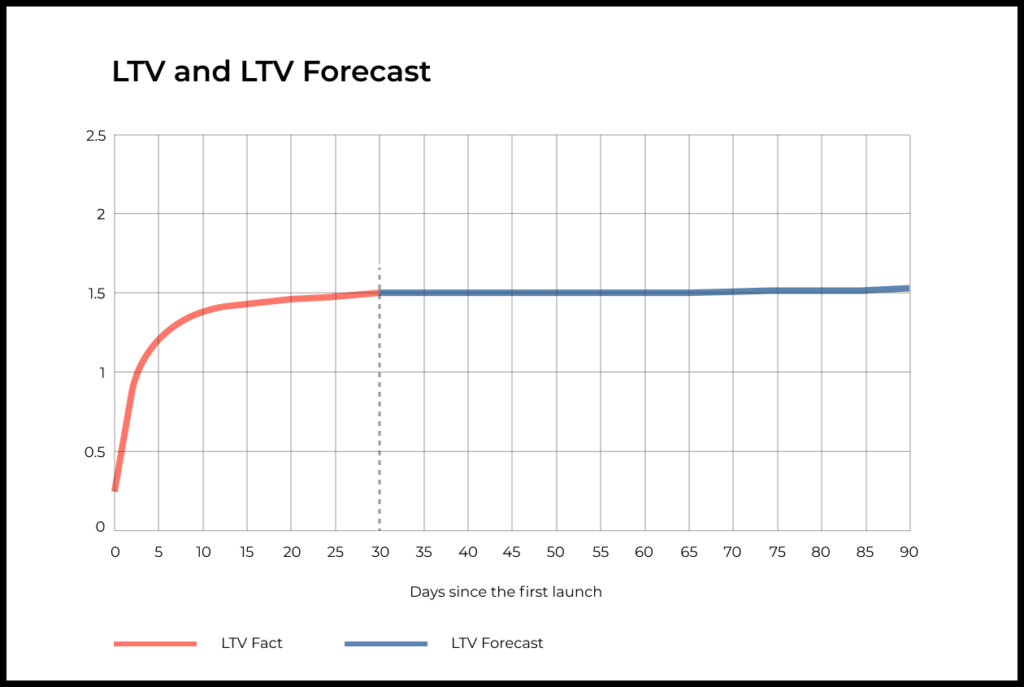
In practice, LTV is usually calculated over a specified period after the user starts using the product, e.g., X days or months. For example, LTV for day 7 or LTV for month 12
The choice of the calculation period depends on the tasks one is trying to solve. For example, if a marketing team acquires users from ad networks and expects to recoup the investment in one year, then the one-year LTV will be crucial for them.
If we calculate LTV by say Day 0, 1, 2 and further on, then we will get an LTV curve in dynamics. The graph of LTV dynamics by day usually looks like this:
Use Cases for Customer Lifetime Value
Customer lifetime value is a critical part of decision-making for both customer-facing teams and executives in the workplace.
Unlike NPS and CSAT, CLV doesn’t measure customer satisfaction, customer experience, or word of mouth marketing, although these factors influence how long people are willing to patronize your business. Instead, it draws a straight line from the customer’s purchasing power to the financial value it provides for your business.
Customer lifetime value helps business executives to develop the right strategies for acquiring and retaining customers. While on that, customer lifetime value enables you to prioritize investments objectively—you’d know when you increase marketing and sales spend to convert a lead.
Product teams consider customer lifetime value as they make product improvements for the market. Sales teams use CLV to decide on the types of customers they should spend time acquiring. In addition, customer support teams depend on CLV to know how much money needs to be spent hiring talented customer support staff to provide impeccable customer service.
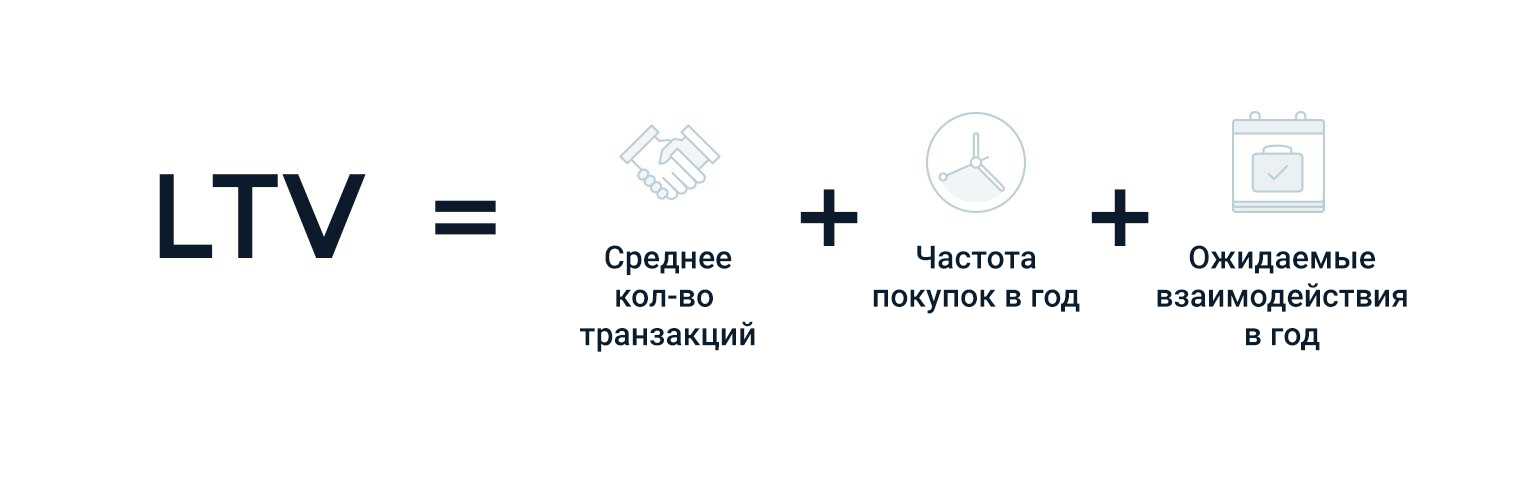
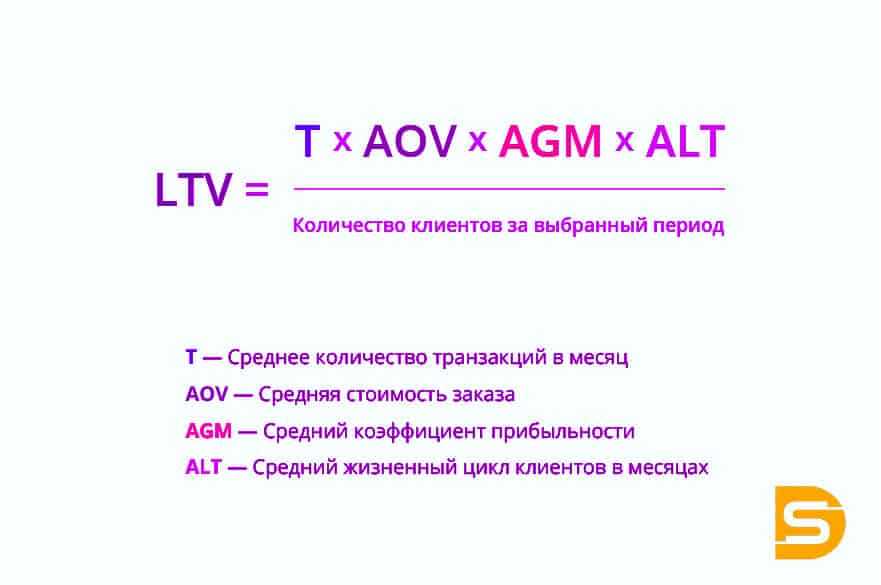
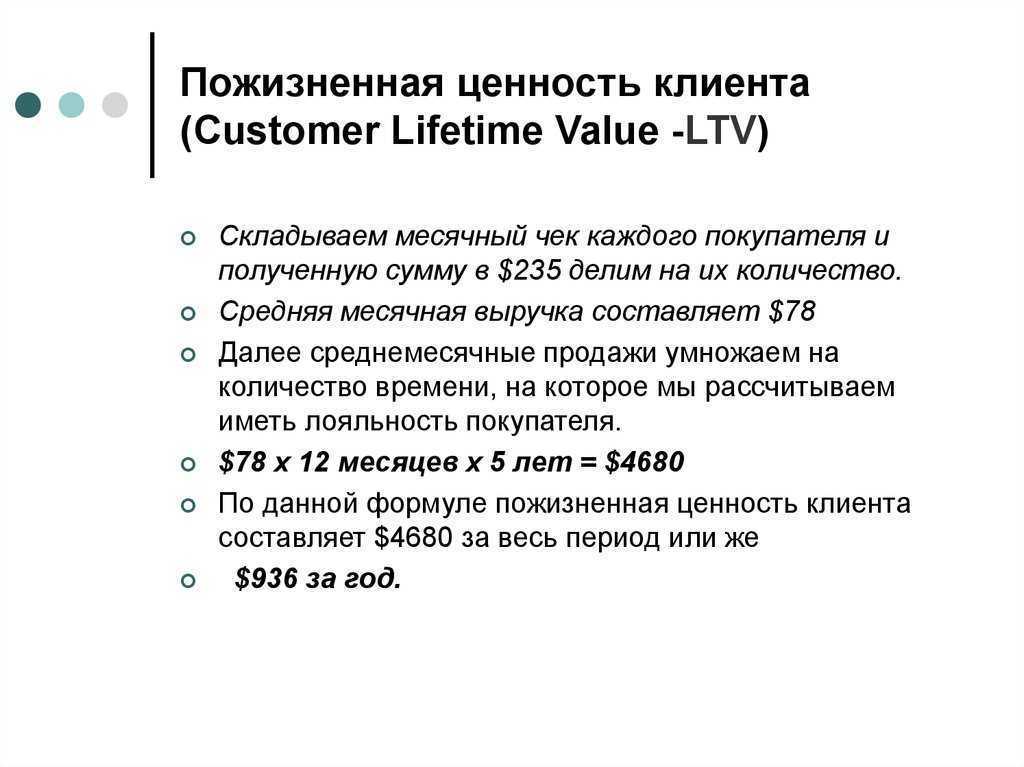
Формула расчета LTV:
Разобравшись с указанными выше показателями данных о работе мобильной игры, давайте разберемся с формулой расчета LTV мобильной игры на разных этапах:
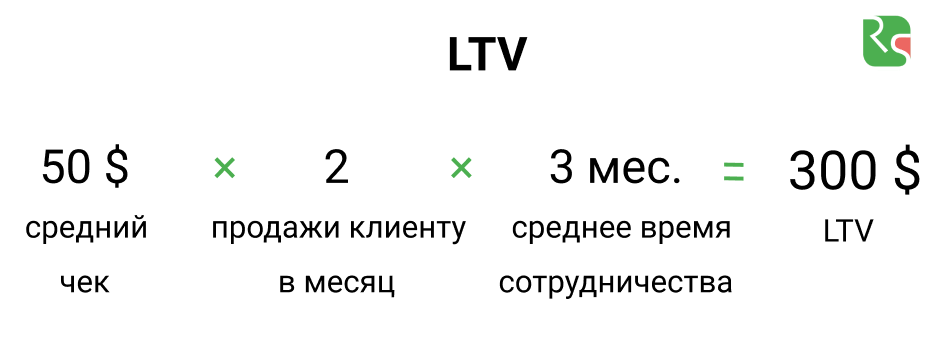
1.LTV = LT * ARPU
Если LT (средний жизненный цикл) пользователя составляет 3 месяца, ARPU (средний доход пользователя) составляет 10 юаней в месяц, тогда LTV = 3 * 10 = 30 юаней.
Эта формула имеет вид: расстояние = скорость * время. Преимущество в том, что ее очень легко понять, а также очевиден недостаток, который носит теоретический характер. Однако при вождении в реальной жизни на скорость автомобиля влияют такие факторы, как мощность, трафик, погода и т. Д., И когда мобильная игра создается впервые, данных нет. Как оценить жизненный цикл пользователя? Кроме того, ARPU не является фиксированным значением. Подробнее см. В следующих двух типах тенденций.
![How to calculate a customer’s lifetime value [ultimate guide]](https://susaninskaya.ru/wp-content/uploads/f/9/7/f97579cf7491224ea2d55e1b66cb408e.jpeg)

2. LTV = N дней проточной воды / N дней пополнения запасов (N≥30)
Как не рассчитать жизненный цикл пользователя? Давайте определим это сами. Рекомендуется определять более длительный период в 30, 60 и 90 дней. Это можно увидеть, наблюдая за уровнем удержания пользователей. Нормальное 60-дневное удержание находится в пределах 1%, что почти соответствует жизненный цикл пользователя. Обычно для этого требуются реальные данные. Вы можете использовать Umeng или Talkingdata, чтобы снизить уровень удержания пользователей в последние месяцы. Вы можете видеть, что удержание пользователей в первые несколько недель составляет около 1%, просто следите за этим количеством дней.
3. Оцените, рассчитав модель коэффициента удержания и модель функции прибыли.
Согласно анализу данных Talkingdata, показатель удержания пользователей должен демонстрировать определенную тенденцию развития, когда будут установлены каналы продвижения и версии продукта. В целом, удержание пользователей будет иметь следующую кривую тенденций развития:
В предыдущие N дней он распадается чрезвычайно быстро, и на терминале появляется стабильная последовательность сходимости распада, поэтому можно рекомендовать сегментированные вычисления. Предположим, что функция удержания является степенной функцией y = a * x ^ b, где x — количество дней использования, а a и b — коэффициенты модели. Первая оценка — это показатель удержания в течение 180 дней. Он использует весовые коэффициенты 2-го, 7-го, 14-го, 30-го и 180-го дней, и значения веса: 2,5, 7, 12, 57,5, 100 (в порядке соответствия). Весовой коэффициент, основанный на формуле LTV, проще, чем интегрирование в степенной функции, и влияние на точность не так велико. После расчета жизненного цикла пользователя значение LTV можно рассчитать, умножив жизненный цикл на ARPDAU.
Перепечатано:http://www.zesmob.com/blog/35474.html?from=singlemessage
Коэффициент удержания клиентов
Коэффициент удержания клиентов (retention rate) отражает то, насколько хорошо компания умеет сохранять своих клиентов. Формула для расчета крайне проста. Главное выбрать правильный период времени, в течение которого оценивается показатель. В зависимости от сферы деятельности компании данный интервал может существенно отличаться.
Коэффициент удержания клиентов = ((количество клиентов на конец периода — количество новых клиентов за период времени) / (количество клиентов на начало периода) х 100%
Коэффициент удержания клиентов легко преобразуется в коэффициент оттока:
Коэффициент оттока (churn rate) = 1-коэффициент удержания клиентов
Если приток клиентов сопоставим с оттоком, то коэффициент удержания будет стремительно падать. Поэтому в компании должна быть культура нулевой толерантности к потере клиентов
Важно постоянно анализировать отток клиентов, честно обсуждать существующие проблемы с сервисом, оптимизировать бизнес-процессы. Более подробно тема борьбы с оттоком раскрыта в другой нашей статье
Какой уровень удержания клиентов считается нормальным? Такого уровня не существует. Тем не менее, сравнение с отраслевыми бенчмарками позволит оценить, насколько ваши показатели близки к средним показателям по индустрии. Такой анализ нужно делать на постоянной основе.
Пример расчет Retention rate
В начале периода у компании было 1 000 клиентов, за год появилось 450 новых клиентов, при этом 150 покупателей перестали пользоваться услугами компании.
Коэффициент удержания = ((1450-150)-450)/1 000)х100% = 85%
Who should measure LTV?
LTV is an especially useful metric for businesses that have high transaction rates and a large customer base, so if your SaaS falls into this category, you will definitely want to keep an eye on this metric.
Conversely, if you have 6 clients, of which 2 are enterprise-level and the rest are variable 3-figure amounts per year, it’s probably a better idea to worry about increasing acquisition rates than it is to measure LTV.
For most SaaS businesses, the responsibility for tracking LTV will fall on the CFO, just as it would for other key financial metrics.
If your SaaS business is really small, it might even be the CEO who takes the lead on monitoring this.
How do you calculate LTV?
This can be as simple or as complicated as you need it to be.
The easiest way to calculate LTV for a given user is to sum the amount of revenue they have paid you over their time as a customer. You can think of this as Gross LTV.
You could add up all your Gross LTV numbers for each customer and divide by the number of customers to get an average.
Slightly more sophisticated is the Net LTV calculation. To work this out for a given user, add up all the revenue they have paid you, but subtract the cost of acquiring them and servicing their account.
I like this model because it gives a more accurate reflection of your earnings per customer. Put another way, it doesn’t matter much if you make an average of $2000 in revenue per customer but spent $500 to acquire them and another $1200 on customer service!
If you want to get really fancy and factor in retention rate and inflation, you might consider the following formula:
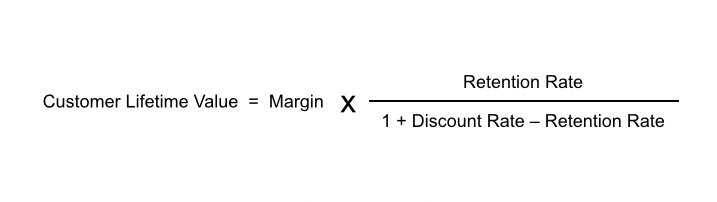
For this approach, the default discount rate is often set at 10%, as a way of simulating the cost of inflation and other typical business fluctuations.
Tips to Increase Customer Lifetime Value
 How can a company influence the customer experience, resulting in an increase in customer lifetime value? Some companies have the luxury of a true “moat,” or an effective defense against competitor disruption. Companies leveraging economies of scale, for example, can attain a much lower price point than the competition.
Most companies, however, do not have this luxury. This means they must implement tactics to improve operational efficiencies and impress customers through targeted, personalized, and relevant communication.
Optimize Onboarding
With churn rates the highest after a single interaction with the average company, it’s important to make the first impression positive. Customers often need education on the features and benefits of your product to truly understand how the product can positively impact their lives.
In a service business, effective onboarding can be as simple as demonstrating a dedication to customer service and availability to solve customer problems. Being attentive to the needs of a first-time customer and relieving any hesitations about their decision to purchase should be top priority for this first interaction.
Effective Communication
An open line of communication between the company and customer strengthens the relationship and makes the company feel more human. In today’s environment, it’s more important than ever to respond to feedback, especially negative comments, and poor ratings.
Customers appreciate when their voices are heard. The simple acknowledgement that a company is receptive to feedback and their problems will be addressed can be a catalyst for repeat business. Increasing the effectiveness of customer communication also applies to sales and marketing copy. You can measure the performance of communication with customers by assessing churn rate and ad conversion rate.
Loyalty Program
Implementing a loyalty program can be a great way to personalize the customer experience while incentivizing repeat purchases. Some common loyalty programs offer reward points, or the ability to unlock free and discounted product after the accumulation of purchases. For example, buy nine cups of coffee and get the tenth free.
Customers are proud of the rewards they accrue and companies are rewarded with an increase in customer lifetime value. An airline, for example, rewards customers who make purchases using their exclusive credit card with free miles that can contribute to the cost of a flight or accrue to a free flight.
Retargeting
One of the most important tactics to improve customer lifetime value is to re-engage customers who have had a previous experience with the brand. Retargeting can be a simple reminder of the company and at the very least, increase brand recognition. Products with a shelf life can greatly benefit from retargeting efforts as their time-sensitive nature will require another purchase.
Customer lifetime value is a metric that all businesses should consider when planning for future growth and projecting profitability pro formas. Businesses should implement strategies to increase the customer lifetime value, especially since the cost to retain an existing customer is substantially less than acquiring a new customer.
What is Customer Lifetime Value?
Customer lifetime represents the total monetary worth of a customer to a business throughout their interactions and relationship with the organization in question. In other words, it is how much a customer is projected to spend on your product or service, from the moment they make their first purchase until they stop patronizing your business.
Common factors considered for Customer Lifetime Value (CLV) include:
- How much a customer spends on every purchase
- The frequency and duration of these purchases.
Here’s a simple scenario that explains this point.
Let’s say Customer A is projected to spend $1,000 per purchase at a 2-year interval over ten years, and Customer B is expected to make a one-time purchase worth $3,000. In this case, Customer A has a higher value than B.
Organizations fuss over customer lifetime value because it has several implications for business growth, revenue, and profit—you can think of it as a cheat sheet for business success. The most obvious impact is it helps businesses to identify the customers with the highest value prospect. With this, you can decide how much money to invest in customer acquisition and customer retention.
For example, if a hot lead is estimated to spend $75,000 on your business over 15 years, investing in that relationship might be a wise call for your organization.
Negative Churn invalidates the LTV formula
In the LTV formula above, I kept things simple by using the term “Churn Rate”. But I should have been more precise and used the term Dollar Churn Rate to avoid confusion with Customer Churn Rate. But now we have a problem, if we insert a negative value in the LTV formula, we don’t get the right answer. And you can tell quite easily without a formula, that if our cohort kept growing at 16% every year (which is what is implied by a negative 16% churn rate), then we would have an infinite future revenue stream that would grow and grow from this cohort.
Our first attempt to model this phenomenon, showed that there is a point where the customer churn starts to bring down the revenue. Here’s a graph showing what would happen if you had a cohort of 100 customers that initially started paying you $100 a month, but each remaining customer increased their payment by $5 every month. The monthly Customer Churn Rate is 3%:
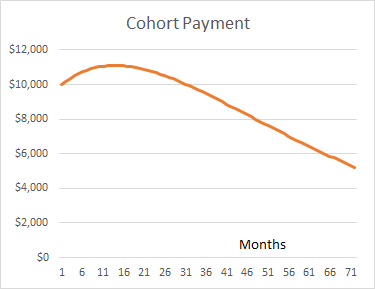
In case of interest, the formula used to compute this graph is:
a = initial ARPA per month x GM %
m = a fixed $ amount of monthly growth in ARPA per account (not compounding)
c = Customer Churn Rate % (in months)
The formula would work equally well for yearly values.
(Note: there is a huge simplification in this formula that we will address later: it assumes a fixed linear expansion in revenue over time, and in most cases this won’t be how expansion revenue happens.)
Customer Lifetime Value Examples for Industries or Business Models
Example 1
A car manufacturer has records the following in a business year:
Average Value of Sale = $1,000,000
Total Number of Transactions = 200
Profit Margin = 2%
Retention Time Period = 4 years
First, we calculate the company’s lifetime value.
Lifetime Value = Average Value of Sale × Number of Transactions × Retention Time Period
$1,000,000 × 200 × 4 = $800,000,000
Next, we multiply lifetime value by the 2% profit margin.
Customer Lifetime Value = $16,000,000
Example 2
A college-based hospitality business records the following numbers for its meal subscription service:
Average Value of Sale = $40,000
Total Number of Transactions = 1,000
Profit Margin = 1%
Retention Time Period = 2 years
Based on these data sets, the lifetime value of the business is;
$40,000 × 1,000 × 2 = $80,000,000
Customer Lifetime Value = $80,000,000 × 1% = $800,000
Which Calculation Method Should I Use?
The way you calculate CLTV will affect what decisions you can safely make based on your results. A formula that doesn’t include expenses or only includes some expenses will make your business seem more profitable than it really is. On the flip side, formulas that include every expense may make it seem like streamlining operations is key to increasing CLTV when improving your retention rate will have a greater impact.

![How to calculate a customer’s lifetime value [ultimate guide]](https://susaninskaya.ru/wp-content/uploads/d/d/9/dd9dcb90eda444f26912cfe717547972.png)

Ultimately, it’s up to you to decide which formula you prefer. Make sure you understand the strengths and weaknesses of your formula of choice. Just know that any CLTV calculation is better than no CLTV calculation.
Acquiring new customers is likely one of your business’s largest expenses. This makes it imperative that you realize your CLTV, identify customers that fall above and below that figure, and learn as a business what you need to do to retain those customers. This will not only increase your CLTV but also the total revenue in your company’s bottom line.
Why is CLTV an Important SaaS Metric?
Why do SaaS businesses care about CLTV?
Here are some key reasons to track, use, and improve CLTV:
#1: Control Customer Acquisition Costs
CLTV goes hand in hand with another important metric known as Customer Acquisition Cost (CAC).
CAC is the total sales and marketing expenses a business makes to convert a lead into a customer. So, basically, CAC includes any investments you make in attracting customers, such as special offers, discounts, and other marketing efforts.
Now, CLTV should always account for CAC, or you will end up spending more than you earn. Specifically, if you’re a growing SaaS company, you should aim for a 3:1 ratio or higher. For example, if your company’s CLTV is $3,000, the total CAC per customer should not be higher than $1,000.
#2: Understand Customer Behavior Better
No business wants to spend money and resources on acquiring customers that won’t be profitable. On the contrary – they all want to direct their sales and marketing efforts toward the best, most loyal leads.
The customer lifetime value metric helps identify who these high-value customers are.
By regularly keeping track of your CLTV, you can segment your customer data into different categories based on their specific lifetime values. The higher the CLTV, the higher their value. Armed with this knowledge, you can then answer key relevant questions about your users and clients, such as:
- Which customer categories have the highest LTV?
- Which offers are best-suited for my customers?
- How much should I spend to acquire a lead?
- How many resources should I invest in retaining or winning back customers?
- How much time should my sales and marketing team spend on customer acquisition?
#3: Boost Customer Loyalty
Consistently optimizing your CLTV and producing value through customer support, loyalty programs, discounts, and special offers increases both customer loyalty and retention.
Additionally, more loyal customers and trust towards your brand can effectively lower the churn rate and increase referrals, positive reviews, and sales.